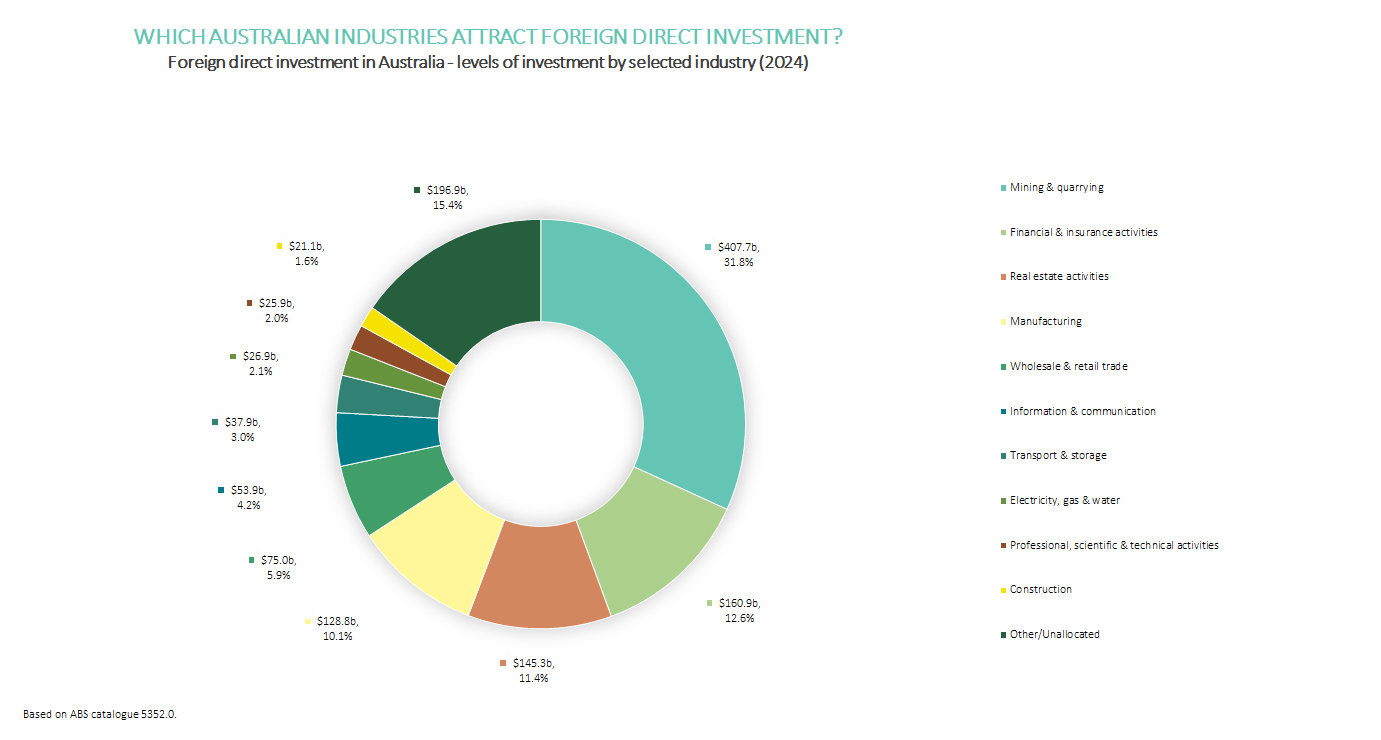
Which Australian industries attract foreign direct investment?
| Rank in 2025 | Industry | 2023 (A$ billion) | 2024 (A$ billion) | 2025 (A$ billion) | % of total | % change 2024 to 2025 |
|---|---|---|---|---|---|---|
| 1 | Mining & quarrying | 402.4 | 408.7 | 398.6 | 30.6 | -2.5 |
| 2 | Financial & insurance activities | 136.5 | 148.5 | 171.1 | 13.1 | 15.2 |
| 3 | Real estate activities | 137.0 | 144.4 | 155.4 | 11.9 | 7.7 |
| 4 | Manufacturing | 118.3 | 126.9 | 125.0 | 9.6 | -1.5 |
| 5 | Wholesale & retail trade | 78.7 | 72.3 | 74.7 | 5.7 | 3.3 |
| 6 | Information & communication | 23.9 | 51.6 | 62.7 | 4.8 | 21.6 |
| 7 | Transport & storage | 30.9 | 36.1 | 38.8 | 3.0 | 7.5 |
| 8 | Professional, scientific & technical activities | 16.4 | 27.8 | 29.8 | 2.3 | 7.0 |
| 9 | Electricity, gas & water | 23.2 | 26.8 | 27.8 | 2.1 | 3.7 |
| 10 | Construction | 20.1 | 20.9 | 18.8 | 1.4 | -9.9 |
| - | Other/Unallocated | 177.6 | 188.4 | 199.6 | 15.3 | 6.0 |
| - | All industries | 1,164.9 | 1,252.2 | 1,302.3 | 100.0 | 4.0 |
Based on ABS catalogue 5352.0.
Last updated: May 2026.