Download PDF version
Contents
- Foreword
- Australia’s economic activities in COVID-19 compared to other economies
- Australia’s key economic indicators 2017-18 to 2019-20
- Australia’s industry structure 2019-20
- Australia’s trade and investment framework
- Australia’s trade balance
- Two-way trade
- Exports
- Minerals and fuels sector
- Services sector - modes of supply
- Manufactures sector
- Rural sector
- Imports
- Australia’s investment landscape
- Inbound investment
- Outbound investment – where does Australia invest
- Two-way investment
- Australian outward related affiliates
- Multilateral and regional organisations
- Australia in value chains
- More information
- Department of Foreign affairs and trade Australian office network
Foreword
Trade and Investment at a Glance is a statistical snapshot of Australia’s trade and investment performance over 2019-20. 2020 was a challenging year. This publication captures the impact of the summer ’s bushfires as well as the early effects of COVID-19 and the Government ’s response.
The health and safety of all Australians is our Government’s number one priority. Australia’s economic and health response to COVID-19 has been among the best in the world.
The Government stepped up to support businesses to manage the economic impacts of COVID-19 through JobKeeper, the Export Market Development Grants (EMDG) program, the International Freight Assistance Mechanism (IFAM) and tourism industry support, among other support measures.
An extra $49.8 million was injected into the EMDG program in the 2019-20 financial year, supporting exporters and tourism businesses to market their products and services around the world. This bolstered the $60 million already assigned to the program. The Australian Government also established the $500 million COVID-19 Export Capital Facility to provide Australian exporters adversely impacted by the pandemic with business-saving loans.
Open and connected two-way supply chains continue to be supported with $110 million allocated to IFAM to keep vital trade links operating during the pandemic. IFAM has been extended to the end of September 2021. This temporary measure is focused on alleviating COVID-related supply chain pressures and reconnecting Australian companies with international markets.
Further, we are investing $72.7 million to help Australian farming, forestry and fishing exporters to expand and diversify their export markets in 2021, as part of the Agri-Business Expansion Initiative (ABEI). Key elements include rapidly scaling-up Austrade export services to increase the number of agri-business clients receiving services, greater access to agricultural market intelligence, enhancing scientific and technical capabilities to advance agricultural technical market access priorities, and short-term agricultural counsellor deployments.
Our Government has taken the next step in Australia’s National Economic Recovery Plan with a $1.2 billion tourism and aviation support package which will target businesses, workers and regions impacted by the loss of international tourists. Measures include a Tourism Aviation Network Support program that will offer 800,000 half price domestic airfares to Australian travellers, support for Australia’s international passenger airlines to maintain more than 8,000 core international aviation jobs, and support for aviation services such as airport security screening, training and certification.
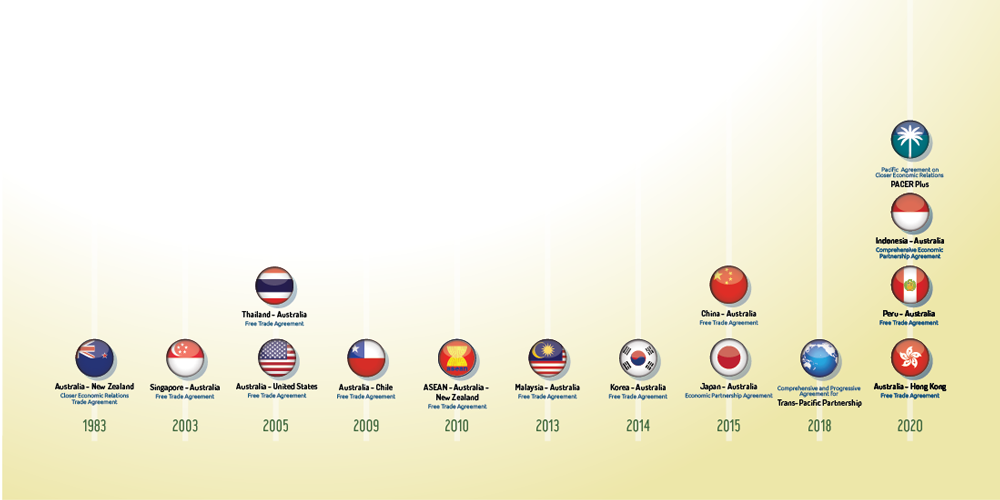
These support measures come on top of the Government ’s work to expand and diversify our FTAs, which now includes 15 agreements and gives Australian exports preferred access to more than two billion consumers. With one in five jobs in Australia being trade-related, maintaining and expanding opportunities for Australian exporters is vital to Australia’s recovery. We will continue the negotiation of free trade agreements with the European Union and the United Kingdom, which will give Australian businesses additional opportunities in markets with more than 500 million consumers.
We also work with other countries through multilateral organisations to help find recovery solutions and strengthen the global rules-based trading system. The selection of Australia’s Mathias Cormann to lead the OECD as Secretary-General from June 2021 is a significant achievement for Australia. It reflects our commitment to multilateralism, liberal democratic values and best-practice market-based policies. Under Mr Cormann ’s leadership, the OECD will work to promote stronger, cleaner, fairer economic growth, raise employment and living standards, and strengthen its outreach into the Indo-Pacific region.
As the global economy recovers from COVID-19, we continue to take a proactive, principled and patient approach as we create new opportunities for Australian businesses and producers to diversify their markets and get to the other side of COVID-19.
The Hon Dan Tehan, MP
Former Minister for Trade, Tourism and Investment
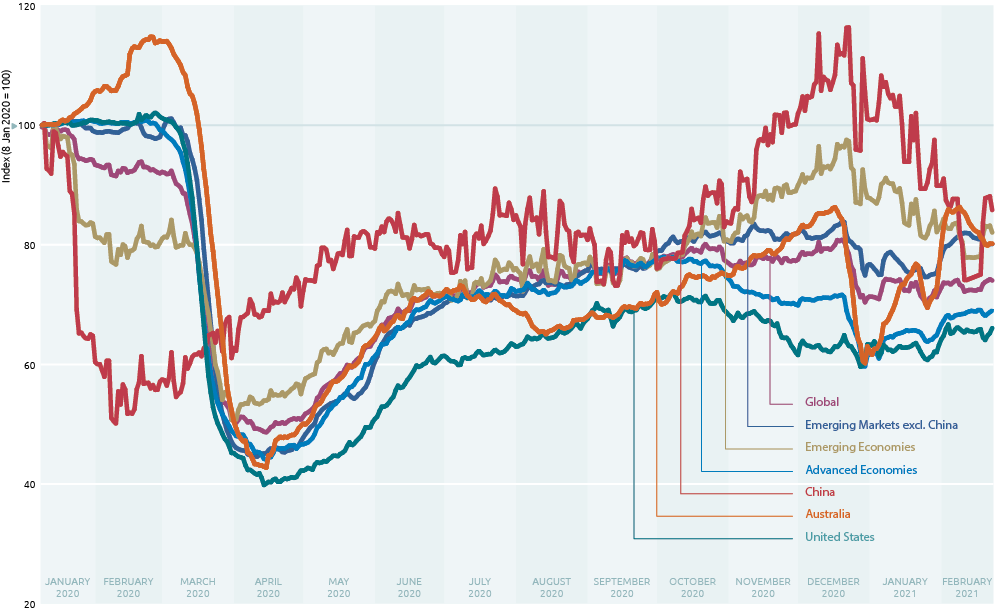
Australia’s economic activities in COVID-19 compared to other economies
Australia’s key economic indicators 2017-18 to 2019-20
| 2017-18 | 2018-19 | 2019-20 | ||
|---|---|---|---|---|
| GDP and Trade (a) | ||||
| Gross domestic product(b) | % change | 3 | 2.2 | -0.3 |
| Exports of goods & services(b) | % change | 4.1 | 4 | -1.9 |
| Imports of goods & services(b) | % change | 7.3 | 0.2 | -7.4 |
| Net exports contribution to GDP | % points | -0.6 | 0.9 | 1.1 |
| Labour force | ||||
| Population(c) | ‘000 | 24,983 | 25,366 | 25,687 |
| Labour force(d) | ‘000 | 13,159 | 13,421 | 13,554 |
| Employed persons(d) | ‘000 | 12,437 | 12,734 | 12,793 |
| - Annual growth | % | 3 | 2.4 | 0.5 |
| Unemployment rate(d) | % | 5.5 | 5.1 | 5.6 |
| Prices and interest rates | ||||
| Consumer prices | % change | 2.1 | 1.6 | -0.3 |
| Interest rates - 90 day bills(d) | % pa | 1.8 | 1.9 | 0.7 |
| (a) Reference year 2018-19. | ||||
| (b) Derived from annual movements in original data. | ||||
| (c) At end June. | ||||
| (d) Derived from original data on an annual average. | ||||
| Based on ABS and Reserve Bank, various catalogues. | ||||
Australia’s industry structure 2019-20
| Gross value added(a) | Employed persons(b) | |||
|---|---|---|---|---|
| $m | % share(c) | '000 | % share | |
| Agriculture, forestry & fishing | 37,683 | 2 | 333.6 | 2.6 |
| Mining | 206,796 | 11.1 | 238.6 | 1.9 |
| Manufacturing | 113,561 | 6.1 | 886.7 | 6.9 |
| Services | 1,336,304 | 71.9 | 11,312.50 | 88.6 |
| Electricity, gas, water & waste | 47,333 | 2.5 | 155.8 | 1.2 |
| Construction | 142,331 | 7.7 | 1,179.00 | 9.2 |
| Wholesale trade | 75,152 | 4 | 391.9 | 3.1 |
| Retail trade | 81,473 | 4.4 | 1,235.60 | 9.7 |
| Accommodation & food services | 39,623 | 2.1 | 851.6 | 6.7 |
| Transport, postal & warehousing | 89,284 | 4.8 | 641 | 5 |
| Information, media & telecommunications | 43,716 | 2.4 | 205 | 1.6 |
| Financial & insurance services | 165,278 | 8.9 | 466.9 | 3.7 |
| Rental, hiring & real estate | 53,685 | 2.9 | 214.4 | 1.7 |
| Professional, scientific & technical | 141,431 | 7.6 | 1,147.80 | 9 |
| Administrative & support | 66,184 | 3.6 | 438 | 3.4 |
| Public administration & safety | 106,553 | 5.7 | 827.5 | 6.5 |
| Education & training | 94,776 | 5.1 | 1,084.90 | 8.5 |
| Health care & social assistance | 143,730 | 7.7 | 1,762.40 | 13.8 |
| Arts & recreation | 15,270 | 0.8 | 225.8 | 1.8 |
| Other services | 30,485 | 1.6 | 484.9 | 3.8 |
| Ownership of dwellings | 164,547 | 8.9 | ||
| Gross value added at basic prices(d) | 1,819,368 | 100.0 | ||
| Taxes less subsidies on products and statistical discrepancy | 1,858,892 | |||
| Total (e) | 1,985,438 | 12,771 | 100.0 | |
| (a) Based on current price GDP. Industry breakdown based on ANZSIC 2006. | ||||
| (b) Derived from original data on an annual average. Year ended June 2019. | ||||
| (c) As a share of GDP at basic prices. | ||||
| (d) Basic prices are amounts received by producers, including the value of any subsidies on products, but before any taxes on products. | ||||
| (e) GDP at purchasers' (market) prices is derived by adding Taxes less subsidies on products and Statistical discrepancy to Gross value added at basic prices. | ||||
| Based on ABS catalogues 5206.0, 6202.0 and 6203.0. | ||||
Australia’s trade and investment framework
Australia takes an active and ambitious multilateral, regional and bilateral Australia will is an outward-looking, open, and sovereign trading nation. Australia’s prosperity is underpinned through enhanced competitiveness, open, diverse and resilient markets, and a rules-based trading system. In the COVID-19 recovery phase, the Australian Government’s focus is ensuring we obtain the full benefits of open trade and investment settings. This is achieved by expanding the options for our exporters in key markets; strengthening and modernising the rules-based international trading system; and promoting the high quality of Australian goods and services overseas.
Our continued engagement with other countries on a bilateral, regional and multilateral basis, including through the World Trade Organization (WTO), Organisation for Economic Co-operation and Development (OECD), Asia Pacific Economic Cooperation (APEC) and G20, aims to protect and advance Australia’s trade and investment interests.
We are also identifying and seeking to address measures introduced by other countries that create unnecessary trade barriers for Australian traders, including COVID-19 measures. Businesses can report export barriers at tradebarriers.gov.au.
Free trade agreements
On 15 November 2020, Ministers from Australia and 14 other countries signed the Regional Comprehensive Economic Partnership. This is a regional free trade agreement that will complement and build upon Australia’s other agreements with 14 other Indo-Pacific countries. The Regional Comprehensive Economic Partnership is a modern and comprehensive FTA covering trade in goods, trade in services, investment, economic and technical cooperation. It also contains trade rules relating to electronic commerce, intellectual property, government procurement, competition, and small and medium sized enterprises. Australia will work towards ratification of the Regional Comprehensive Economic Partnership in 2021.
The Australian Government will continue to expand and strengthen our network of free trade agreements. In 2021, Australia will negotiate new free trade agreements, including separate negotiations with the United Kingdom and European Union. Work is also underway on an upgrade to the ASEAN-Australia-New Zealand FTA (AANZFTA).
For more information on Australia’s free trade agreements, including those agreements under negotiation, visit: fta.gov.au
The FTA Portal is a free website providing easy-to-access information that helps Australians import and export using free trade agreements. Find it at: ftaportal.dfat.gov.au
Alternative text for timeline graph
1983
- Australia - New Zealand Closer Economic Relations Trade Agreement
2003
- Singapore - Australia Free Trade Agreement
2005
- Thailand - Australia Free Trade Agreement
- Australia - United States Free Trade Agreement
2009
- Australia - Chile Free Trade Agreement
2010
- ASEAN - Australia - New Zealand Free Trade Agreement
2013
- Malaysia - Australia Free Trade Agreement
2014
- Korea - Australia Free Trade Agreement
2015
- China - Australia Free Trade Agreement
- Japan - Australia Economic Partnership Agreement
2018
- Comprehensive and Progressive Agreement for Trans-Pacific Partnership
2020
- Pacific Agreement on Closer Economic Relations PACER Plus Indonesia - Australia Comprehensive Economic Partnership Agreement
- Peru - Australia Free Trade Agreement
- Australia - Hong Kong Free Trade Agreement
Australia’s trade balance
Australia’s trade balance is the difference between what we export and what we import.
It is calculated by subtracting the value of the goods and services Australia buys from overseas from the value of the goods and services we sell to other countries.
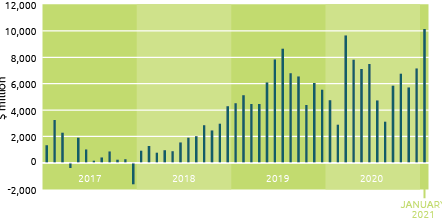
As of December 2020, Australia had a positive trade balance of $6,785 million (seasonally adjusted).
Australia’s trade balance over time
The graph below shows the variation in Australia’s monthly trade balance over the past few years and reflects the minimal impact of the COVID-19 Pandemic on trade during 2020.
Alternative text for Australia’s trade balance over time graph
| Date | $ million |
|---|---|
| 1/01/2017 | 1328 |
| 1/02/2017 | 3244 |
| 1/03/2017 | 2267 |
| 1/04/2017 | -376 |
| 1/05/2017 | 1893 |
| 1/06/2017 | 1007 |
| 1/07/2017 | 144 |
| 1/08/2017 | 403 |
| 1/09/2017 | 854 |
| 1/10/2017 | 238 |
| 1/11/2017 | 263 |
| 1/12/2017 | -1600 |
| 1/01/2018 | 915 |
| 1/02/2018 | 1279 |
| 1/03/2018 | 767 |
| 1/04/2018 | 953 |
| 1/05/2018 | 865 |
| 1/06/2018 | 1544 |
| 1/07/2018 | 1890 |
| 1/08/2018 | 2004 |
| 1/09/2018 | 2844 |
| 1/10/2018 | 2450 |
| 1/11/2018 | 2960 |
| 1/12/2018 | 4280 |
| 1/01/2019 | 4509 |
| 1/02/2019 | 5117 |
| 1/03/2019 | 4460 |
| 1/04/2019 | 4460 |
| 1/05/2019 | 6074 |
| 1/06/2019 | 7828 |
| 1/07/2019 | 8646 |
| 1/08/2019 | 6789 |
| 1/09/2019 | 6538 |
| 1/10/2019 | 4372 |
| 1/11/2019 | 6050 |
| 1/12/2019 | 5535 |
| 1/01/2020 | 4728 |
| 1/02/2020 | 2886 |
| 1/03/2020 | 9636 |
| 1/04/2020 | 7798 |
| 1/05/2020 | 7098 |
| 1/06/2020 | 7484 |
| 1/07/2020 | 4723 |
| 1/08/2020 | 3110 |
| 1/09/2020 | 5829 |
| 1/10/2020 | 6737 |
| 1/11/2020 | 5707 |
| 1/12/2020 | 7133 |
| 1/01/2021 | 10142 |
Source: www.dfat.gov.au/trade/resources/trade-statistics/Pages/australias-trade-balance
Two-way trade
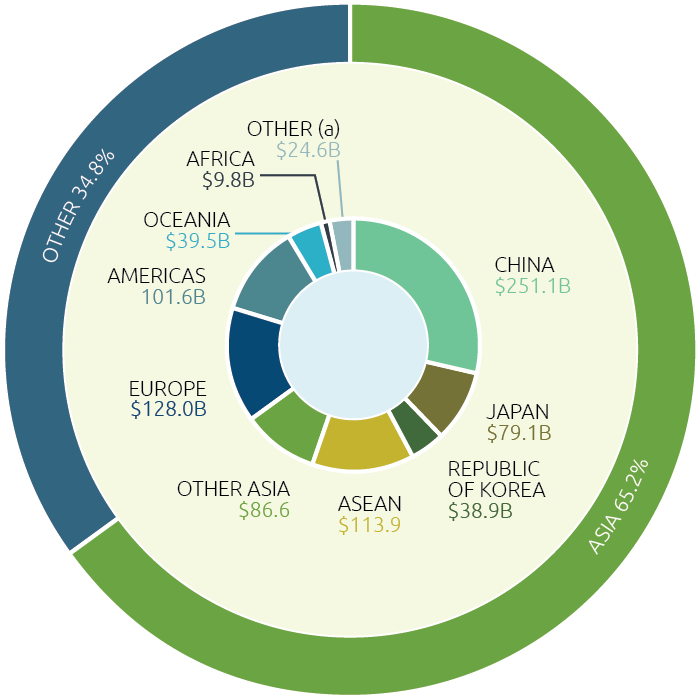
Asia continues to dominate Australia’s two-way trade flows with 65.2 per cent of the market. China remains our major two-way trading partner. Japan, Republic of Korea and ASEAN also offer significant market opportunities for Australian businesses especially as these economies rebound from COVID-19.
Australia’s two-way trade by region 2019-20
Alternative text for Australia’s two-way trade by region 2019-20 graph
| Region | $Billion | %Percentage |
|---|---|---|
| China | 251.1 | Asia - 65.2% |
| Japan | 79.1 | |
| Republic of Korea | 38.9 | |
| ASEAN | 113.9 | |
| Other Asia | 86.6 | |
| Europe | 128 | Other - 34.8% |
| Americas | 101.6 | |
| Oceania | 39.5 | |
| Africa | 9.8 | |
| Other (a) | 24.6 |
Regional breakdowns:
- Asia includes Central Asia; Middle East; North Asia; South East Asia and Southern Asia. Europe includes Eastern Europe; Northern Europe; South Eastern Europe, Southern Europe and Western Europe.
- Americas includes North America; the Caribbean; Central America and South America.
- Oceania includes Antarctica and Pacific Island countries and territories.
- Africa includes Central and West Africa; North Africa and Southern and East Africa.
(a) Includes confidential items of trade.
Based on ABS catalogues 5368.0 and 5368.0.55.003 and unpublished ABS data.
Australia’s top two-way trading partners 2019-20
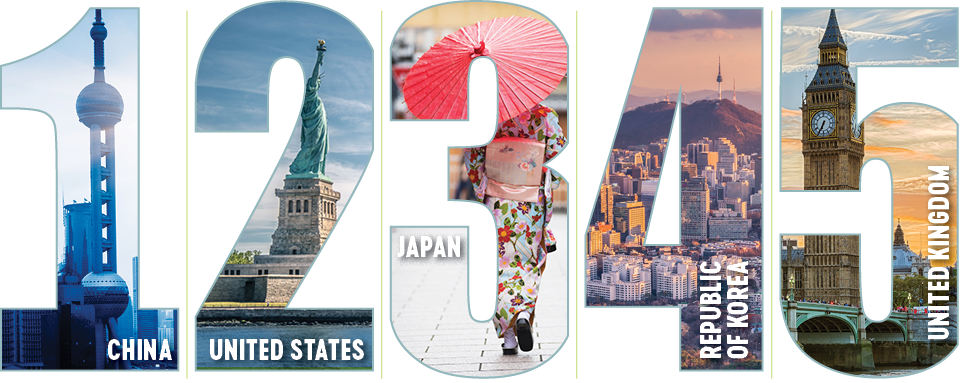
Australia’s top ten trading partners in order were China, the United States, Japan, the Republic of Korea, United Kingdom, Singapore, New Zealand, India, Germany and Malaysia.
China remained our largest two-way trading partner with a 28 per cent share of our two-way trade valued at just over $250 billion. The United States moved up as our second two-way trading partner, replacing Japan, but with only nine per cent of the market valued at $80 billion. The United Kingdom moved up from seventh to become our fifth two-way trading partner replacing Singapore who moved to sixth.
Australia’s top 10 two-way trading partners 2019-20
| ($ billion) | |||||
|---|---|---|---|---|---|
| Rank | Trading partners(a)(b) | Goods | Services | Total | % share |
| 1 | China | 232.4 | 18.7 | 251.1 | 28.8 |
| 2 | United States | 55.4 | 25.4 | 80.8 | 9.2 |
| 3 | Japan | 73 | 6.1 | 79.1 | 9.1 |
| 4 | Republic of Korea | 36.5 | 2.4 | 38.9 | 4.5 |
| 5 | United Kingdom | 22.8 | 13.9 | 36.7 | 4.2 |
| 6 | Singapore | 21.7 | 9.6 | 31.3 | 3.6 |
| 7 | New Zealand | 17.6 | 11.1 | 28.7 | 3.3 |
| 8 | India | 15.7 | 10.6 | 26.2 | 3 |
| 9 | Germany | 17.3 | 4.5 | 21.8 | 2.5 |
| 10 | Malaysia | 18.2 | 3.4 | 21.6 | 2.5 |
| Total top 10 trading partners | 510.5 | 105.6 | 616.1 | 70.6 | |
| Total two-way trade(c) | 693.8 | 179.4 | 873.1 | 100 | |
| of which | APEC | 543.4 | 102 | 645.4 | 73.9 |
| ASEAN | 87.1 | 26.7 | 113.8 | 13 | |
| EU28 | 58.7 | 20 | 78.7 | 9 | |
| OECD | 281.3 | 86.7 | 368 | 42.1 | |
| (a) All data is on a balance of payments basis, except for goods by country which are on a recorded trade basis. | |||||
| (b) May exclude selected confidential export and import commodities. Refer to the DFAT website for more information and a list of the excluded commodities. | |||||
| (c) Totals may not add due to rounding. | |||||
| Based on ABS trade data on DFAT STARS database, ABS catalogue 5368.0.55.003 and unpublished ABS data. | |||||
Exports
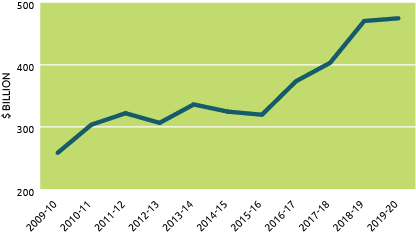
Despite disruptions to supply chains due to COVID-19, including border closures and other responses by Australia and our trading partners, exports remained steady. Australians exported just under $475 billion worth of goods and services worldwide during the 2019-20 reporting period with China remaining our largest market.
Australia’s exports(a)(b)
Alternative text for Australia’s exports graph
| Financial year | 2009-10 | 2010-11 | 2011-12 | 2012-13 | 2013-14 | 2014-15 | 2015-16 | 2016-17 | 2017-18 | 2018-19 | 2019-20 |
|---|---|---|---|---|---|---|---|---|---|---|---|
| $ billion | 257.8 | 303.7 | 322.1 | 306.6 | 336.3 | 324.7 | 319.7 | 373.7 | 403.4 | 470.8 | 475.2 |
(a) Balance of payments basis.
(b) By value.
Based on ABS catalogues 5302.0 & 5368.0.
Australia’s top 10 export markets 2019-20
| ($ billion) | |||||
|---|---|---|---|---|---|
| Rank | Markets(a)(b) | Goods | Services | Total | % share |
| 1 | China | 151.4 | 16.2 | 167.6 | 35.3 |
| 2 | Japan | 53.8 | 2.4 | 56.2 | 11.8 |
| 3 | Republic of Korea | 25.9 | 1.8 | 27.6 | 5.8 |
| 4 | United States | 17.9 | 9.5 | 27.4 | 5.8 |
| 5 | United Kingdom | 15.8 | 5.1 | 21 | 4.4 |
| 6 | India | 10.9 | 7.7 | 18.6 | 3.9 |
| 7 | Singapore | 12.5 | 4.5 | 17 | 3.6 |
| 8 | New Zealand | 10.1 | 5.6 | 15.7 | 3.3 |
| 9 | Taiwan | 11.8 | 1.1 | 13 | 2.7 |
| 10 | Malaysia | 8.2 | 2.3 | 10.5 | 2.2 |
| Total top 10 markets | 318.3 | 56.3 | 374.6 | 78.8 | |
| Total exports(c) | 383 | 92.3 | 475.2 | 100 | |
| of which | APEC | 323.6 | 53.9 | 377.5 | 79.4 |
| ASEAN | 39.8 | 12.8 | 52.7 | 11.1 | |
| EU28 | 11.7 | 7.1 | 18.8 | 4 | |
| OECD | 140.8 | 35.1 | 175.9 | 37 | |
| (a) All data is on a balance of payments basis, except for goods by country which are on a recorded trade basis. | |||||
| (b) May exclude selected confidential export and import commodities. Refer to the DFAT website (www.dfat.gov.au/trade/resources/trade-statistics/Pages/trade-time-seriesdata) for more information and a list of the excluded commodities. | |||||
| (c) Totals may not add due to rounding. | |||||
| Based on ABS trade data on DFAT STARS database, ABS catalogue 5368.0.55.003 and unpublished ABS data. | |||||
Australia’s global export ranking 2019
| How we compare with the rest of the world (US$ billion) | |||||
|---|---|---|---|---|---|
| Rank | Economy | Goods(a) | Services(b) | Total exports | % share |
| 1 | China | 2,499 | 283 | 2,783 | 11.1 |
| 2 | United States | 1,643 | 876 | 2,519 | 10 |
| 3 | Germany | 1,489 | 341 | 1,830 | 7.3 |
| 4 | Netherlands | 709 | 264 | 974 | 3.9 |
| 5 | Japan | 706 | 205 | 911 | 3.6 |
| 6 | United Kingdom | 470 | 416 | 886 | 3.5 |
| 7 | France | 571 | 288 | 859 | 3.4 |
| 8 | Italy | 533 | 122 | 655 | 2.6 |
| 9 | Republic of Korea | 542 | 102 | 645 | 2.6 |
| 10 | Hong Kong(a) | 535 | 101 | 636 | 2.5 |
| 11 | Singapore | 391 | 205 | 596 | 2.4 |
| 12 | Belgium | 445 | 121 | 566 | 2.3 |
| 13 | Canada | 447 | 100 | 547 | 2.2 |
| 14 | India | 324 | 214 | 539 | 2.1 |
| 15 | Spain | 334 | 158 | 492 | 2 |
| 22 | Australia | 272 | 71 | 343 | 1.4 |
| Total exports | 18,933 | 6,144 | 25,077 | 100 | |
| (a) Goods on recorded trade basis. | |||||
| (b) Services on balance of payments basis. | |||||
| (c) Special Administrative Region of China. | |||||
| Source: WTO online database. | |||||
Australia’s exports by sector (a) 2019-20
Alternative text for Australia’s exports by sector 2019-20 graph
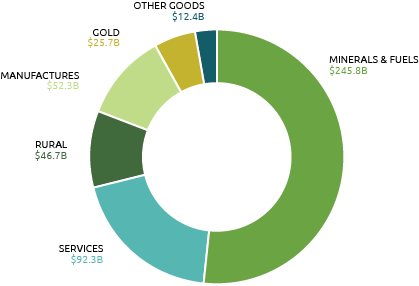
| Sector | $Billion |
|---|---|
| Minerals & Fuels | 245.8 |
| Services | 92.3 |
| Rural | 46.7 |
| Manufactures | 52.3 |
| Gold | 25.7 |
| Other Goods | 12.4 |
(a) Balance of payments basis.
Based on ABS catalogues 5302.0 & 5368.0.
Services and technology are embedded in all of Australia’s export sectors. Land transport and electricity services used in the mining and export of resources are reflected in trade on a ‘value added’ basis. On a ‘gross exports’ basis, which is the more common statistical practice, these values are not separately identified. However, using the value added measure, Australia’s domestic services industries account for over 45 per cent of the value of exports.
Australia’s top 20 exports 2019-20
| Rank | Commodity(a) | $ million | % share | % change |
|---|---|---|---|---|
| 1 | Iron ores & concentrates | 102,864 | 21.6 | 32.7 |
| 2 | Coal | 54,620 | 11.5 | -21.5 |
| 3 | Natural gas | 47,525 | 10 | -4.4 |
| 4 | Education-related travel services(b) | 39,661 | 8.3 | 4.9 |
| 5 | Gold | 24,394 | 5.1 | 29.3 |
| 6 | Personal travel (excl education) services | 16,368 | 3.4 | -27.1 |
| 7 | Beef | 11,258 | 2.4 | 18.8 |
| 8 | Aluminium ores & concentrates (incl alumina) |
8,875 | 1.9 | -21.9 |
| 9 | Crude petroleum | 8,568 | 1.8 | 0.9 |
| 10 | Copper ores & concentrates | 6,854 | 1.4 | 14.8 |
| 11 | Professional services | 6,107 | 1.3 | 9.2 |
| 12 | Telecom, computer & information services | 5,909 | 1.2 | 17 |
| 13 | Financial services | 5,696 | 1.2 | 14.7 |
| 14 | Meat (excl beef) | 5,520 | 1.2 | 7.2 |
| 15 | Technical & other business services | 5,154 | 1.1 | 9.3 |
| 16 | Wheat | 3,847 | 0.8 | 5.2 |
| 17 | Aluminium | 3,761 | 0.8 | -11.5 |
| 18 | Other ores & concentrates(c) | 3,678 | 0.8 | 4.4 |
| 19 | Pharm products (excl medicaments) | 3,631 | 0.8 | 22.9 |
| 20 | Copper | 3,433 | 0.7 | -12.8 |
| Total exports(d) | 475,240 | 100 | 0.9 | |
| (a) Goods trade is on a recorded trade basis. Services trade is on a balance of payments basis. | ||||
| (b) Includes student expenditure on tuition fees and living expenses. | ||||
| (c) Mainly of Lead, Zinc and Manganese ores & concentrates. | ||||
| (d) Total exports on a balance of payments basis. | ||||
| Based on ABS trade data on DFAT STARS database and ABS catalogues 5302.0 & 5368.0. | ||||
Minerals and fuels sector
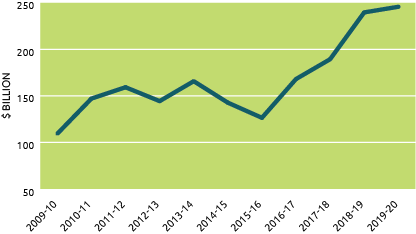
In 2019-20, minerals and fuels remained Australia’s largest export sectors. Australia’s exports of iron ore and concentrates, coal and natural gas remained as our top three exports overall. Whilst iron ore recorded an increase of 32.7 per cent, coal and natural gas declined 21.5 per cent and 4.4 per cent respectively.
Through its Critical Minerals Strategy, the Government is committed to realising Australia’s critical minerals potential and positioning Australia as a trusted and first-choice supplier of critical minerals. Work is well underway across government to attract investment and secure offtake of these minerals, including collaboration with key international partners.
Australia’s minerals and fuels exports (a) (b)
Alternative text for Australia’s minerals and fuels exports graph
| Financial year | 2009-10 | 2010-11 | 2011-12 | 2012-13 | 2013-14 | 2014-15 | 2015-16 | 2016-17 | 2017-18 | 2018-19 | 2019-20 |
|---|---|---|---|---|---|---|---|---|---|---|---|
| $ billion | 109.413 | 147.177 | 159.333 | 144.436 | 165.853 | 142.782 | 126.506 | 168.173 | 189.467 | 239.803 | 245.849 |
(a) Balance of payments basis.
(b) By value.
Based on ABS catalogues 5302.0 & 5368.0.
Australia’s top 20 minerals and fuels exports 2019-20
| Rank | Commodity(a)(b) | $ million | % share | % change |
|---|---|---|---|---|
| 1 | Iron ores & concentrates | 102,864 | 41.8 | 32.7 |
| 2 | Coal | 54,620 | 22.2 | -21.5 |
| 3 | Natural gas | 47,525 | 19.3 | -4.4 |
| 4 | Aluminium ores & concentrates (incl alumina) | 8,875 | 3.6 | -21.9 |
| 5 | Crude petroleum | 8,568 | 3.5 | 0.9 |
| 6 | Copper ores & concentrates | 6,854 | 2.8 | 14.8 |
| 7 | Other ores & concentrates(c) | 3,678 | 1.5 | 4.4 |
| 8 | Refined petroleum | 2,411 | 1 | -19.8 |
| 9 | Precious metal ores & conc (excl gold) | 1,868 | 0.8 | 24.8 |
| 10 | Liquefied propane & butane | 1,623 | 0.7 | 54.7 |
| 11 | Non-ferrous waste & scrap | 1,321 | 0.5 | -2.6 |
| 12 | Crude minerals | 1,237 | 0.5 | -26.6 |
| 13 | Ferrous waste & scrap | 953 | 0.4 | -11.3 |
| 14 | Nickel ores & concentrates | 478 | 0.2 | 39.8 |
| 15 | Stone, sand & gravel | 154 | 0.1 | 0.5 |
| 16 | Natural abrasives | 87 | 0 | -15.8 |
| 17 | Residual petroleum products | 26 | 0 | -28 |
| 18 | Petroleum gases | 17 | 0 | -56.5 |
| 19 | Crude fertilisers | 12 | 0 | 15.3 |
| 20 | Sulphur & iron pyrites | 1 | 0 | -38 |
| Total minerals and fuels exports(d) | 245,849 | 100 | 2.5 | |
| (a) Recorded trade basis. | ||||
| (b) Excludes confidential items of trade. | ||||
| (c) Mainly Zinc ores & concentrates, Manganese ores & concentrates and Lead ores & concentrates. | ||||
| (d) Total minerals and fuels exports on a balance of payments basis. | ||||
| Based on ABS trade data on DFAT STARS database and ABS catalogues 5302.0 & 5368.0. | ||||
Services sector - modes of supply
Services trade comprises four modes of supply for services
Mode 1: Cross Border Supply – where the supplier provides services from one country to another with the use of telecommunications (digital technology) or through the post, but only the service crosses the border and neither the supplier nor the consumer moves. Examples include consultancies, tele-health, distance training or providing legal advice via the telephone.
Mode 2: Consumption Abroad – where the supplier provides services to customers who cross the border to consume them. Only the consumer moves. For example, students travelling overseas to attend university or school or as tourists.
Mode 3: Commercial Presence - where the services supplier sets up operations in another country to provide services there. Only the supplier moves but by establishing an on-the-ground presence in the consumer market as a locally established affiliate, subsidiary, or representative office. For example, branch offices established overseas by banks, hotels, construction companies, legal firms, etc.)
Mode 4: Movement of Natural Persons – where the services supplier moves temporarily from one country to another to deliver services there. For Example, fly-in, fly-out mine workers and fruit pickers or a consultant, an architect, or health expert temporarily travelling overseas to provide services.
Impact of COVID-19
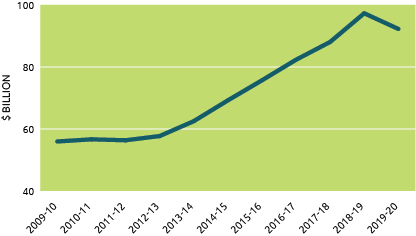
The graph below shows a drop in services exports in the March-June 2020 quarter which coincided with the beginnings of international travel restrictions. This drop can be largely attributed to the severe impact of those restrictions on Mode 2 (Tourism and International Student numbers) and Mode 4 where Australian providers travel abroad to deliver services (e.g. health professionals, architects, mining specialists etc). With continuation of international travel restrictions, we can expect to see a rise in mode 1 (Cross-border supply via digital technology) as businesses innovate and adapt their service delivery models to digital platforms.
Australia’s services exports (a)(b)
Alternative text for Australia’s services exports graph
| Financial year | 2009-10 | 2010-11 | 2011-12 | 2012-13 | 2013-14 | 2014-15 | 2015-16 | 2016-17 | 2017-18 | 2018-19 | 2019-20 |
|---|---|---|---|---|---|---|---|---|---|---|---|
| $ billion | 55.961 | 56.652 | 56.349 | 57.708 | 62.502 | 69.210 | 75.676 | 82.318 | 88.049 | 97.301 | 92.261 |
(a) Balance of payments basis.
(b) By value.
Based on ABS catalogues 5302.0 & 5368.0.
Services exports action plan
The Australian Government and the services industry have partnered to develop the first national strategy to boost Australia’s services exports – the Services Exports Action Plan. Over 80 ‘actions’ focussed on achieving five macro-level outcomes form the core of the Action Plan. Its aim is to build an internationally competitive services sector in Australia that underpins and boosts exports and the economy. The Action Plan will increase transparency of government initiatives and actions that are focused on enhancing services exports. For more information and to download the Action Plan: www.services-exports.gov.au
Australia’s services exports(a) 2019-20
| $ million | % share | % change | |
|---|---|---|---|
| Manufactured services on physical inputs owned by others | 0 | 0 | .. |
| Maintenance & repair | 33 | 0 | -26.7 |
| Transport | 6,886 | 7.5 | -10.9 |
| Passenger(b) | 2,462 | 2.7 | -19.9 |
| Freight | 283 | 0.3 | 2.2 |
| Other transport | 2,608 | 2.8 | -10 |
| Postal & courier services | 1,533 | 1.7 | 3.7 |
| Travel | 55,665 | 60.3 | -11.9 |
| Business | 1,984 | 2.2 | -31.1 |
| Personal | 53,681 | 58.2 | -10.9 |
| - Education-related | 37,338 | 40.5 | -1.3 |
| - Other personal (c) | 16,343 | 17.7 | -27.2 |
| Other services | 29,677 | 32.2 | 12.5 |
| Construction | 694 | 0.8 | -28.5 |
| Insurance & pension | 667 | 0.7 | 6.5 |
| Financial | 5,346 | 5.8 | 7.6 |
| Intellectual property charges | 1,249 | 1.4 | -3.7 |
| Telecommunications, computer & information | 5,315 | 5.8 | 12.6 |
| Other business services | 12,006 | 13 | 7.8 |
| Personal, cultural and recreational | 3,279 | 3.6 | 123.7 |
| Government services | 1,121 | 1.2 | -5.8 |
| Total services exports | 92,261 | 100 | -5.2 |
| (a) Balance of payments basis. | |||
| (b) Passenger services includes air transport-related agency fees & commissions. | |||
| (c) Inbound tourism for mainly recreational purposes. | |||
| Based on ABS catalogues 5302.0 & 5368.0. | |||
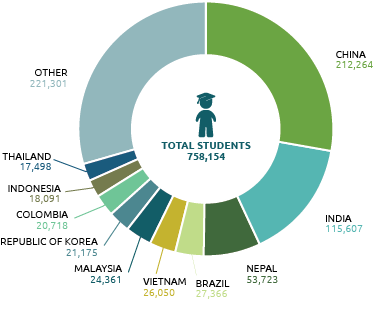
Top 10 country of origin, international students in Australia 2019
Alternative text for top 10 country of origin, international students in Australia 2019 graph
| Country of Origin, | No. of Students |
|---|---|
| China | 212,264 |
| India | 115,607 |
| Nepal | 53,723 |
| Brazil | 27,366 |
| Vietnam | 26,050 |
| Malaysia | 24,361 |
| Republic of Korea | 21,175 |
| Colombia | 20,718 |
| Indonesia | 18,091 |
| Thailand | 17,498 |
| Other | 221,301 |
| Total | 758,154 |
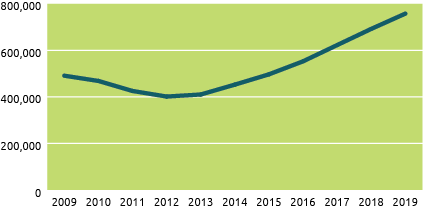
International student numbers
Alternative text for student numbers graph
| Year | 2009 | 2010 | 2011 | 2012 | 2013 | 2014 | 2015 | 2016 | 2017 | 2018 | 2019 |
|---|---|---|---|---|---|---|---|---|---|---|---|
| Total | 491336 | 468718 | 425601 | 401726 | 410493 | 452909 | 497160 | 553057 | 622905 | 692506 | 758154 |
During 2019 demand for Australian education services was strong with 758,154 international student enrolments in Australian education institutions. China and India were the top two source countries with 212,264 and 115,607 enrolments respectively.
Australia’s international visitors, year ending June 2020
| Rank | Economy | Number of visitors ('000) | % change on 2018-19 |
|---|---|---|---|
| 1 | New Zealand | 1,028 | -26.9 |
| 2 | China | 900 | -37.2 |
| 3 | United States | 582 | -28.4 |
| 4 | United Kingdom | 562 | -21.8 |
| 5 | Japan | 375 | -22.5 |
| 6 | Singapore | 316 | -32.1 |
| 7 | Malaysia | 285 | -23.4 |
| 8 | India | 259 | -33.5 |
| 9 | Hong Kong(a) | 227 | -26.6 |
| 10 | Republic of Korea | 192 | -31.5 |
| Other economies | 2,011 | -24.8 | |
| Total | 6,737 | -27.9 | |
| (a) Special Administrative Region of China. | |||
| Source: Department of Home Affairs. | |||
The data above, reflects the immediate impact the closure of Australia’s international borders, from 17 March to 30 June 2020, has had on tourism, one of our largest export markets.
Top 10 economies by expenditure, year ended June 2020
| Rank | Economy | Number of visitors ('000) | % change on 2018-19 |
|---|---|---|---|
| 1 | China | 8,410 | -29.4 |
| 2 | United States | 2,913 | -27 |
| 3 | United Kingdom | 2,617 | -22.8 |
| 4 | New Zealand | 1,914 | -25.8 |
| 5 | Japan | 1,577 | -23 |
| 6 | India | 1,380 | -21.8 |
| 7 | Republic of Korea | 1,040 | -28.7 |
| 8 | Singapore | 1,039 | -32.9 |
| 9 | Hong Kong (a) | 1,000 | -26.4 |
| 10 | Germany | 941 | -18.4 |
| Other economies | 10,500 | -21.5 | |
| Total | 33,330 | -25.2 | |
| (a) Special Administrative Region of China. | |||
| Source: Tourism Research Australia: International Visitor Survey. | |||
Manufactures sector
Australian manufacturing businesses employ around 900,000 Australians. As COVID-19 restrictions closed borders and disrupted established international supply chains , Australian businesses came up with solutions to meet demand. From gin to hand sanitiser, high fashion to personal protective equipment (PPE) there were many examples of innovative Australian businesses rising to the challenges raised by the pandemic.
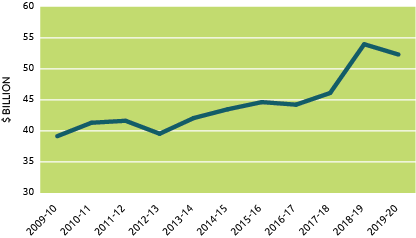
Australia’s manufactures exports(a)(b)
Alternative text for Australia’s manufactures exports graph
| Financial year | 2009-10 | 2010-11 | 2011-12 | 2012-13 | 2013-14 | 2014-15 | 2015-16 | 2016-17 | 2017-18 | 2018-19 | 2019-20 |
|---|---|---|---|---|---|---|---|---|---|---|---|
| $ billion | 39.160 | 41.322 | 41.641 | 39.552 | 42.081 | 43.499 | 44.651 | 44.237 | 46.117 | 53.985 | 52.329 |
(a) Balance of payments basis.
(b) By value.
Based on ABS catalogues 5302.0 & 5368.0.
Australia’s top 20 manufactures exports 2019-20
| Rank | Commodity(a)(b) | $ million | % share | % change |
|---|---|---|---|---|
| 1 | Aluminium | 3,761 | 7.2 | -11.5 |
| 2 | Pharmaceutical products (excl medicaments) | 3,631 | 6.9 | 22.9 |
| 3 | Copper | 3,433 | 6.6 | -12.8 |
| 4 | Medicaments (incl veterinary) | 2,912 | 5.6 | 10.8 |
| 5 | Telecom equipment & parts | 2,499 | 4.8 | 13.8 |
| 6 | Aircraft, spacecraft & parts | 2,354 | 4.5 | -7.6 |
| 7 | Measuring & analysing instruments | 2,043 | 3.9 | 35 |
| 8 | Medical instruments (incl veterinary) | 1,709 | 3.3 | 3.4 |
| 9 | Zinc | 1,302 | 2.5 | -19 |
| 10 | Nickel | 1,142 | 2.2 | -31.7 |
| 11 | Perfumery & cosmetics (excl soap) | 1,071 | 2 | 12.6 |
| 12 | Pigments, paints & varnishes | 987 | 1.9 | 0.3 |
| 13 | Computers | 975 | 1.9 | 7 |
| 14 | Vehicle parts & accessories | 920 | 1.8 | 4.4 |
| 15 | Paper & paperboard | 884 | 1.7 | -13.8 |
| 16 | Civil engineering equipment & parts | 813 | 1.6 | 11.8 |
| 17 | Lead | 801 | 1.5 | -13.8 |
| 18 | Specialised machinery & parts | 799 | 1.5 | -0.5 |
| 19 | Jewellery | 680 | 1.3 | 19.4 |
| 20 | Starches, inulin & wheat gluten | 665 | 1.3 | 1.1 |
| Total manufactures exports(c) | 52,329 | 100 | -3.1 | |
| (a) Recorded trade basis. | ||||
| (b) Excludes confidential items of trade. | ||||
| (c) Total manufactures exports on a balance of payments basis. | ||||
| Based on ABS trade data on DFAT STARS database and ABS catalogues 5302.0 & 5368.0. | ||||
Rural sector
Australia’s agriculture, forestry and fisheries exports
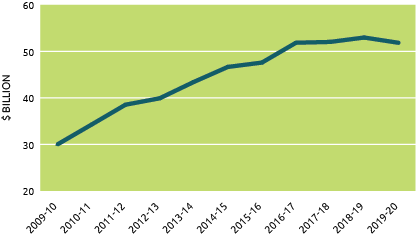
Despite disruptions to major markets, beef remained our strongest agricultural export with a total value of $11,258 million in 2019-20, while other meat exports (excluding beef) and wheat increased by 7.2 and 5.2 per cent respectively.
Australia’s agriculture, forestry and fisheries exports (a) (b)
Alternative text for Australia’s agriculture, forestry and fisheries exports graph
| Financial year | 2009-10 | 2010-11 | 2011-12 | 2012-13 | 2013-14 | 2014-15 | 2015-16 | 2016-17 | 2017-18 | 2018-19 | 2019-20 |
|---|---|---|---|---|---|---|---|---|---|---|---|
| $ billion | 29.993900 | 34.259700 | 38.549600 | 39.919500 | 43.431600 | 46.667100 | 47.599700 | 51.869800 | 52.042800 | 52.986900 | 51.863700 |
(a) Definition of agriculture, forestry and fisheries includes alcoholic beverages as set out in the WTO International Trade Statistics publication.
(b) By value.
Based on ABS catalgoue 5368.0 and ABS special data services.
Australia’s Top 20 agriculture, forestry and fisheries exports 2019-20
| Rank | Commodity(a)(b) | $ million | % share | % change |
|---|---|---|---|---|
| 1 | Beef | 11,258 | 21.7 | 18.8 |
| 2 | Meat (excl beef) | 5,520 | 10.6 | 7.2 |
| 3 | Wheat | 3,847 | 7.4 | 5.2 |
| 4 | Wine | 2,897 | 5.6 | -1.8 |
| 5 | Edible products & preparations | 2,757 | 5.3 | -6.3 |
| 6 | Fruit & nuts | 2,523 | 4.9 | 4.2 |
| 7 | Wool & other animal hair (incl tops) | 2,516 | 4.9 | -34.1 |
| 8 | Live animals (excl seafood) | 2,231 | 4.3 | 14 |
| 9 | Sugars, molasses & honey | 1,776 | 3.4 | 11.9 |
| 10 | Vegetables | 1,471 | 2.8 | 23.2 |
| 11 | Milk, cream, whey & yoghurt | 1,451 | 2.8 | 5.8 |
| 12 | Animal feed | 1,375 | 2.7 | -2.1 |
| 13 | Wood in chips or particles | 1,238 | 2.4 | -22.5 |
| 14 | Oil-seeds & oleaginous fruits, soft | 1,188 | 2.3 | 19.1 |
| 15 | Barley | 1,028 | 2 | -25.6 |
| 16 | Cheese & curd | 985 | 1.9 | -0.4 |
| 17 | Cotton | 964 | 1.9 | -62.3 |
| 18 | Cereal preparations | 925 | 1.8 | -0.5 |
| 19 | Crustaceans | 803 | 1.5 | -21.4 |
| 20 | Wood, rough | 592 | 1.1 | -9.5 |
| Total agriculture, forestry & fisheries exports(c) | 51,864 | 100 | -2.1 | |
| (a) Recorded trade basis. | ||||
| (b) Excludes confidential items of trade except sugar. | ||||
| (c) Definition of agriculture, forestry and fisheries includes alcoholic beverages as set out in the WTO International Trade Statistics publication. | ||||
| Based on ABS catalogue 5368.0 and ABS special data services. | ||||
Imports
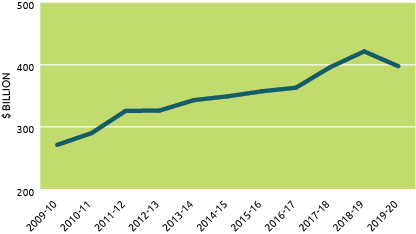
Australia’s imports fell by over 5.7 per cent during 2019-20 due to travel related and other restrictions. Total value fell from $421.4 billion in 2018-2019 to $397.9 billion in 2019-2020.
Personal travel services received by Australians abroad was the largest hit with a decline of 28.1 per cent.
Australia’s imports (a)(b)
Alternative text for Australia’s imports graph
| Financial year | 2009-10 | 2010-11 | 2011-12 | 2012-13 | 2013-14 | 2014-15 | 2015-16 | 2016-17 | 2017-18 | 2018-19 | 2019-20 |
|---|---|---|---|---|---|---|---|---|---|---|---|
| $ billion | 271.2 | 290 | 325.8 | 326.5 | 343.2 | 349.4 | 357.5 | 363.3 | 396.3 | 421.8 | 397.9 |
(a) Balance of payments basis.
(b) By value.
Based on ABS catalogues 5302.0 & 5368.0.
Australia’s top 20 imports 2019-20
| Rank | Commodity(a)(b) | $ million | % share | % change |
|---|---|---|---|---|
| 1 | Personal travel (excl education) services | 33,288 | 8.4 | -28.1 |
| 2 | Refined petroleum | 21,721 | 5.5 | -13.4 |
| 3 | Passenger motor vehicles | 19,093 | 4.8 | -11.5 |
| 4 | Telecom equipment & parts | 15,230 | 3.8 | 4.4 |
| 5 | Computers | 10,398 | 2.6 | 6.5 |
| 6 | Freight services | 10,363 | 2.6 | 2.5 |
| 7 | Crude petroleum | 9,474 | 2.4 | -29.4 |
| 8 | Gold | 8,812 | 2.2 | 59.7 |
| 9 | Professional services | 8,291 | 2.1 | 7.4 |
| 10 | Medicaments (incl veterinary) | 8,124 | 2 | 8.6 |
| 11 | Goods vehicles | 8,075 | 2 | -23.6 |
| 12 | Pharmaceuticals products (excl medicaments) | 6,075 | 1.5 | 25.5 |
| 13 | Telecom, computer & information services | 5,952 | 1.5 | 24.1 |
| 14 | Technical & other business services | 5,792 | 1.5 | 4.3 |
| 15 | Passenger transport services(c) | 5,242 | 1.3 | -30.4 |
| 16 | Charges for intellectual property | 4,914 | 1.2 | -2.1 |
| 17 | Furniture, mattresses & cushions | 4,828 | 1.2 | -3.3 |
| 18 | Civil engineering equipment & parts | 4,453 | 1.1 | -12.4 |
| 19 | Plastic articles | 4,099 | 1 | 6.1 |
| 20 | Electrical machinery & parts | 3,954 | 1 | -0.2 |
| Total imports(d) | 397,905 | 100 | -5.7 | |
| (a) Goods trade is on a recorded trade basis. Services trade is on a balance of payments basis. | ||||
| (b) Excludes imports of large aircraft which are treated confidentially by the ABS. DFAT estimates aircraft imports would rank within Australia's top 20 imports with a value around $4.6 billion in 2018-19. . | ||||
| (c) Includes Related agency fees & commissions. | ||||
| (d) Total imports on a balance of payments basis. | ||||
| Based on ABS trade data on DFAT STARS database and ABS catalogues 5302.0 & 5368.0. | ||||
Australia’s top 10 import sources 2019-20
| ($ billion) | |||||
|---|---|---|---|---|---|
| Rank | Sources(a)(b) | Goods | Services | Total | % share |
| 1 | China | 81 | 2.4 | 83.4 | 21 |
| 2 | United States | 37.4 | 15.9 | 53.4 | 13.4 |
| 3 | Japan | 19.2 | 3.7 | 23 | 5.8 |
| 4 | Germany | 13.7 | 3 | 16.7 | 4.2 |
| 5 | Thailand | 14.6 | 1.8 | 16.3 | 4.1 |
| 6 | United Kingdom | 7 | 8.8 | 15.7 | 4 |
| 7 | Singapore | 9.2 | 5.1 | 14.3 | 3.6 |
| 8 | New Zealand | 7.5 | 5.5 | 13 | 3.3 |
| 9 | Republic of Korea | 10.6 | 0.6 | 11.2 | 2.8 |
| 10 | Malaysia | 10.1 | 1.1 | 11.2 | 2.8 |
| Total top 10 sources | 210.3 | 47.8 | 258.1 | 64.9 | |
| Total imports(c) | 310.8 | 87.1 | 397.9 | 100 | |
| of which: | APEC | 219.9 | 48.1 | 267.9 | 67.3 |
| ASEAN | 47.3 | 13.8 | 61.1 | 15.4 | |
| EU (excl UK) | 47 | 12.9 | 59.9 | 15.1 | |
| OECD | 140.4 | 51.6 | 192.1 | 48.3 | |
| (a) All data is on a balance of payments basis, except for goods by country which are on a recorded trade basis. | |||||
| (b) May exclude selected confidential import commodities. Refer to the DFAT website (http://dfat.gov.au/about-us/publications/trade-investment/Pages/dfat-adjustments-to-abs-official-trade-data) for more information and a list of the commodities excluded. | |||||
| (c) Totals may not add due to rounding. | |||||
| Based on ABS trade data on DFAT STARS database, ABS catalogue 5368.0.55.003 and unpublished ABS data. | |||||
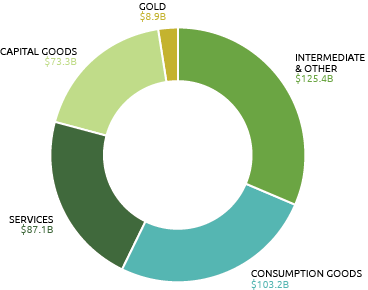
Australia’s imports by sector(a) 2019-20
Alternative text for Australia’s imports by sector 2019-20 graph
| Sector | $Billion |
|---|---|
| Intermediate & other | 125.4 |
| Consumption goods | 103.2 |
| Services | 87.1 |
| Capital goods | 73.3 |
| Gold | 8.9 |
(a) Balance of payments basis.
Based on ABS catalogues 5302.0 & 5368.0.
The largest share of Australia’s imports by sector were intermediate goods, comprising raw materials and components used by Australian firms to make goods for domestic and export markets.
Australia’s global import ranking 2019
| How we compare with the rest of the world (US$ billion) | |||||
|---|---|---|---|---|---|
| Rank | Economy | Goods(a) | Services(b) | Total imports | % share |
| 1 | United States | 2,567 | 588 | 3,156 | 12.6 |
| 2 | China | 2,078 | 501 | 2,579 | 10.3 |
| 3 | Germany | 1,234 | 365 | 1,599 | 6.4 |
| 4 | United Kingdom | 696 | 284 | 980 | 3.9 |
| 5 | Japan | 721 | 204 | 925 | 3.7 |
| 6 | France | 654 | 263 | 917 | 3.7 |
| 7 | Netherlands | 635 | 246 | 882 | 3.5 |
| 8 | India | 486 | 179 | 665 | 2.7 |
| 9 | Hong Kong (c) | 578 | 79 | 657 | 2.6 |
| 10 | Republic of Korea | 503 | 126 | 630 | 2.5 |
| 11 | Italy | 474 | 124 | 598 | 2.4 |
| 12 | Canada | 464 | 115 | 579 | 2.3 |
| 13 | Singapore | 359 | 199 | 558 | 2.2 |
| 14 | Belgium | 426 | 120 | 547 | 2.2 |
| 15 | Mexico | 467 | 36 | 504 | 2 |
| 23 | Australia | 224 | 72 | 296 | 1.2 |
| Total imports | 19,263 | 5,826 | 25,090 | ||
| (a) Goods on recorded trade basis. | |||||
| (b) Services on balance of payments basis. | |||||
| (c) Special Administrative Region of China. | |||||
| Source: WTO online database. | |||||
Australia’s investment landscape
Foreign investment plays an important role in the Australian economy by promoting economic activity.
There are several types of foreign investment: direct, portfolio (for example, purchase of shares and securities) and ’s investment (for example loans and reserve assets). Foreign direct investment (FDI) occurs when a foreign individual or entity establishes a new business or acquires 10 per cent or more share of a local enterprise and has some control over its operations.
FDI through both majority and minority ownership supports 1 in 10 jobs in Australia. Businesses with foreign investment generated around 40 per cent of Australia’s total exports, worth around $132 billion. FDI has given the Australian economy depth and resilience, it has stimulated growth, and it has added to prosperity by enabling jobs, services and opportunities for Australians.
Australia will continue to welcome foreign investment as we reshape Australia’s economy in the rebound from COVID. The global marketplace for foreign investment is competitive. Businesses seeking investment must show the potential for an attractive return. Austrade assists by engaging with investors to promote Australia’s long-term positive fundamentals and opportunities in priority sectors such as advanced manufacturing and the circular economy.
Australians expect investment in Australia to be on our terms. The Australian Government ensures that investments are not contrary to the national interest. Through a package of measures and reforms implemented in January 2021, we have strengthened our foreign investment regime to protect national security, streamline non-sensitive investments, and ensure investors comply with conditions they have signed up to.
Inbound investment
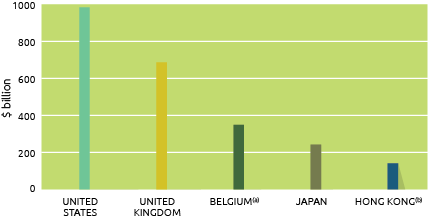
The United States and United Kingdom are the biggest investors in Australia, followed by Belgium, Japan and Hong Kong (SAR of China).
China is our ninth largest foreign investor, with 2.0 per cent of the total. However, the levels of Hong Kong (SAR of China) and Chinese investment in Australia have grown significantly over the past decade.
The United States was Australia’s largest foreign investor by a wide margin, accounting for $983.7 billion in investments in Australia at the end of 2019, up 3.6 per cent on 2018.
Australia’s Top 10 investment sources(a) 2019
| ($ million) | |||
|---|---|---|---|
| Rank(b) | Country | Direct investment | Total investment(c) |
| 1 | United States | 205,163 | 983,742 |
| 2 | United Kingdom | 127,121 | 686,115 |
| 3 | Belgium(d) | 3,543 | 348,133 |
| 4 | Japan | 116,102 | 241,091 |
| 5 | Hong Kong(e) | 16,119 | 140,726 |
| 6 | Singapore | 36,065 | 99,916 |
| 7 | Netherlands | 54,788 | 86,714 |
| 8 | Luxembourg | 8,065 | 85,464 |
| 9 | China | 45,992 | 78,152 |
| 10 | New Zealand | 5,591 | 64,360 |
| Total all economies | 1,019,483 | 3,844,537 | |
| of which: | APEC | 500,732 | 1,745,910 |
| ASEAN | 56,596 | 134,653 | |
| EU (excl UK) | 110,959 | 683,868 | |
| OECD | 630,754 | 2,815,945 | |
| (a) Foreign investment in Australia: level of investment (stocks) as at 31 December 2018. | |||
| (b) Ranked on level of total investment in Australia. | |||
| (c) Includes portfolio investment. | |||
| (d) The majority of total investment from Belgium is portfolio investment liabilities in the form of debt securities (Belgium hosts a major clearing house and despository for euro-denominated bonds and other securities, Euroclear). | |||
| (e) Special Administrative Region of China. | |||
| Source: ABS catalogue 5352.0. | |||
Australia’s inward foreign rirect investment global ranking 2019
| How we compare with the rest of the world | ||||
|---|---|---|---|---|
| Rank | Country | US$b | % change | % share |
| 1 | United States | 9,466 | 27.4 | 26 |
| 2 | United Kingdom | 2,075 | 7.5 | 5.7 |
| 3 | Hong Kong(a) | 1,868 | -4.9 | 5.1 |
| 4 | China | 1,769 | 8.7 | 4.9 |
| 5 | Netherlands | 1,750 | 3.8 | 4.8 |
| 6 | Singapore | 1,698 | 10.5 | 4.7 |
| 7 | Switzerland | 1,351 | -0.3 | 3.7 |
| 8 | Ireland | 1,120 | 12 | 3.1 |
| 9 | Canada | 1,037 | 21.7 | 2.8 |
| 10 | Germany | 953 | 2 | 2.6 |
| 11 | France | 869 | 5.9 | 2.4 |
| 12 | British Virgin Islands | 826 | 7.6 | 2.3 |
| 13 | Spain | 752 | 2.2 | 2.1 |
| 14 | Australia | 714 | 1.8 | 2 |
| 15 | Brazil | 641 | 12.7 | 1.8 |
| World inward stock | 36,470 | 22.9 | ||
| Special Administrative Region of China. | ||||
| Source: UNCTADstat database. | ||||
Australia’s top 5 total foreign investment sources 2019(a)
Total foreign investment includes all types of investment: direct, portfolio, financial derivatives, reserve assets and other investment.
Alternative text for Australia’s top 5 total foreign investment sources 2019 graph
| Country | United States | United Kingdom | Belgium(a) | Japan | Hong Kong(b) |
|---|---|---|---|---|---|
| $ billion | 983.7 | 686.1 | 348.1 | 241.1 | 140.7 |
(a) The majority of total investment from Belgium is portfolio investment liabilities in the form of debt securities (Belgium hosts a major clearing house and despository for euro-denominated bonds and other securities, Euroclear).
(b) Special Administrative Region of China.
Based on ABS catalogue 5352.0.
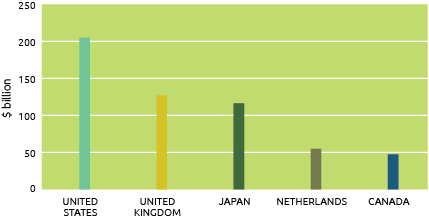
Australia’s top 5 foreign direct investment sources 2019(a)
Foreign Direct investment is where an investor acquires 10 per cent or more ownership in a business or asset.
Alternative text for Australia’s top 5 foreign direct investment sources 2019 graph
| Country | United States | United Kingdom | Japan | Netherlands | Canada |
|---|---|---|---|---|---|
| $ billion | 205.2 | 127.1 | 116.1 | 54.8 | 47.1 |
(a) Data at year end.
Based on ABS catalogue 5352.0.
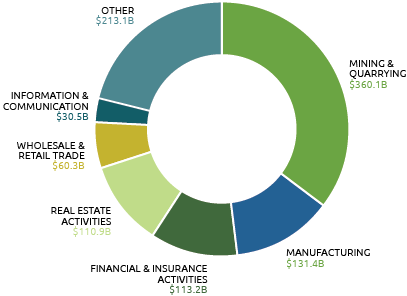
Australia’s foreign direct investment by industry 2019(a)
Alternative text for australia’s foreign direct investment by industry 2019 graph
| Industry | $Billion |
|---|---|
| Mining & Quarrying | 360.1 |
| Manufacturing | 131.4 |
| Financial & Insurance activities | 113.2 |
| Real Estate activities | 110.9 |
| Wholesale & Retail trade | 60.3 |
| Information & Communication | 30.5 |
| Other | 213.1 |
(a) Data at year end.
Based on ABS catalogue 5352.0.
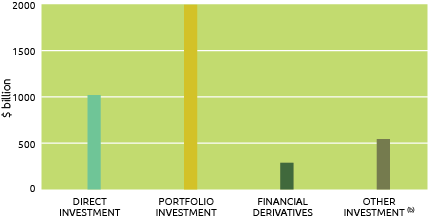
Foreign investment in Australia by type 2019(a)
Alternative text for foreign investment in Australia by type 2019 graph
| Type | Direct investment | Portfolio investment | Financial derivatives | Other investment (a) |
|---|---|---|---|---|
| $ billion | 1019.5 | 1996.4 | 285.8 | 542.8 |
(a) Data at year end.
(b) Includes loans, trade credit, currency, deposits and reserve assets.
Based on ABS catalogue 5352.0.
Outbound investment
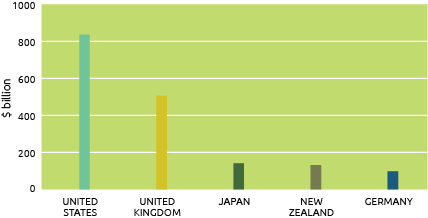
Australian businesses invest huge amounts of money in other economies. At the end of 2019, the total amount of Australian money invested overseas was around $3.0 trillion.
The United States and the United Kingdom were the top two destinations for Australian investment, followed by Japan and New Zealand as our third and fourth largest destinations.
At the end of 2019, Australian investments in the US totalled $837 billion and our investment in the UK was $507 billion.
Australian investment in Asia has increased dramatically over the past decade. Between 2009 and 2019, our investments to major Asian economies (China, Hong Kong (SAR of China), India, Japan, Republic of Korea, Taiwan and all ASEAN members) has increased from $120 billion to $472 billion.
Australia’s top 5 total investment abroad destinations 2019(a)
Alternative text for Australia’s top 5 total investment abroad destinations 2019 graph
| Country | United States | United Kingdom | Japan | New Zealand | Germany |
|---|---|---|---|---|---|
| $ billion | 837.4 | 507.4 | 139.6 | 130.5 | 97.1 |
(a) Data at year end.
Based on ABS catalogue 5352.0.
Australia’s top 10 investment destinations(a) 2019
| ($ million) | |||
|---|---|---|---|
| Rank(b) | Country | Direct investment | Total investment(c) |
| 1 | United States | 145,818 | 837,359 |
| 2 | United Kingdom | 143,461 | 507,440 |
| 3 | Japan | 1,653 | 139,567 |
| 4 | New Zealand | 83,608 | 130,451 |
| 5 | Germany | np | 97,057 |
| 6 | China | 15,511 | 85,268 |
| 7 | Singapore | 28,112 | 84,077 |
| 8 | Canada | 35,096 | 83,400 |
| 9 | Cayman Islands | np | 82,381 |
| 10 | Hong Kong(d) | 7,631 | 63,426 |
| Total all countries | 826,804 | 2,953,056 | |
| of which: | APEC | 352,815 | 1,530,987 |
| ASEAN | 45,448 | 124,683 | |
| EU (excl UK) | 60,003 | 327,428 | |
| OECD | 476,026 | 2,062,249 | |
| (a) Australian investment abroad: level of investment (stocks) as at 31 December 2019. | |||
| (b) Ranked on total Australian investment abroad. | |||
| (c) Includes portfolio investment. | |||
| (d) Special Administrative Region of China. np = not published. |
|||
| Source: ABS catalogue 5352.0. | |||
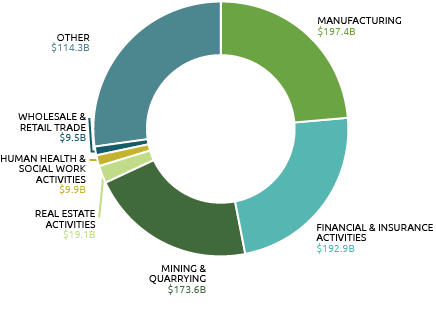
Australia’s direct investment abroad by industry 2019(a)(b)
Alternative text for Australia’s direct investment abroad by industry 2019 graph
| Industry | $Billion |
|---|---|
| Manufacturing | 197.4 |
| Financial & Insurance activities | 192.9 |
| Mining & Quarrying | 173.6 |
| Real estate activities | 19.1 |
| Human Health & Social Work activites | 9.9 |
| Wholesale & Retail trade | 9.5 |
| Other | 114.3 |
(a) Data at year end.
(b) Amounts either suppressed by confidentiality or not attributable to a specific category.
Based on ABS catalogue 5352.0.
Australia’s top 5 direct investment abroad destinations 2019(a)
Alternative text for Australia’s top 5 direct investment abroad destinations 2019 graph
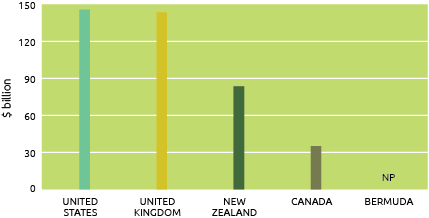
| Country | United States | United Kingdom | New Zealand | Canada | Bermuda |
|---|---|---|---|---|---|
| $ billion | 145.8 | 143.5 | 83.6 | 35.1 | np |
(a) Data at year end.
Based on ABS catalogue 5352.0.
Australia’s outward direct investment abroad global ranking 2019
| ($ million) | ||||
|---|---|---|---|---|
| Rank | Country | US$b | % change | % share |
| 1 | United States | 7,722 | 19.7 | 22.3 |
| 2 | Netherlands | 2,565 | 7.8 | 7.4 |
| 3 | China | 2,099 | 5.9 | 6.1 |
| 4 | United Kingdom | 1,949 | 9 | 5.6 |
| 5 | Japan | 1,818 | 16 | 5.3 |
| 6 | Hong Kong(a) | 1,794 | -1.9 | 5.2 |
| 7 | Germany | 1,719 | 4.1 | 5 |
| 8 | Canada | 1,652 | 21 | 4.8 |
| 9 | France | 1,533 | 2.2 | 4.4 |
| 10 | Switzerland | 1,526 | 2.1 | 4.4 |
| 11 | Singapore | 1,106 | 7.8 | 3.2 |
| 12 | Ireland | 1,085 | 15.1 | 3.1 |
| 13 | British Virgin Islands | 911 | 4.7 | 2.6 |
| 14 | Belgium | 656 | 10.6 | 1.9 |
| 15 | Spain | 607 | 4 | 1.8 |
| 16 | Australia | 579 | 16.5 | 1.7 |
| World outward stock | 34,571 | 9.7 | ||
| (a) Special Administrative Region of China. | ||||
| Source: UNCTADstat database. | ||||
Two-way investment
At the end of 2019 two-way Australian investment of all types amounted to $6.8 trillion dollars. Of that total, $3.8 trillion was invested in Australia by foreign entities or persons, while Australians or Australian entities invested $3.0 trillion overseas.
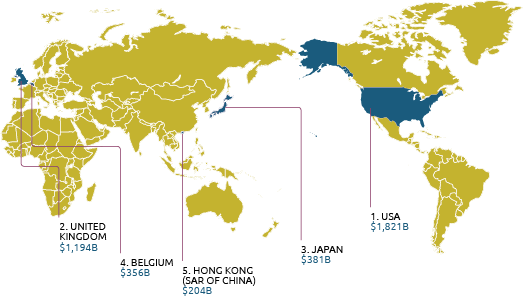
Australia’s top 5 two-way investment partners 2019
Alternative text for Australia’s top 5 two-way investment partners 2019 infographic
| Rank | Country | $Billion |
|---|---|---|
| 1 | USA | 1,821 |
| 2 | United Kindom | 1,194 |
| 3 | Japan | 381 |
| 4 | Belgium | 356 |
| 5 | Hong Kong (SAR of China) | 204 |
Australian outward related affiliates
In September 2020, the Australian Bureau of Statistics (ABS) released a new dataset: Australian Outward Foreign Affiliates Trade 2018-19. This data is the first time since 2002-03 that the ABS has measured the overseas economic activity of Australia’s 5,176 majority-owned foreign affiliates (i.e. subsidiaries, branches and joint ventures where Australian ownership is at least 50 per cent).
In 2018-19 these entities posted sales of $213 billion in their host economies, employed 412,000 people at an average wage of $79,784 per annum, and added $160 billion in value to those economies. They also remitted $15 billion back to Australia in that year.
This dataset also highlights the importance of foreign affiliates in the delivery of particular Australian services, especially in financial and insurance, construction, engineering and other technical and health services. For example, nearly all health services provided abroad in 2018-19 were delivered via foreign affiliates: $6.4 billion in affiliates sales abroad compared with just $34 million in exports identified in the annual balance-of-payments figures.
Multilateral and regional organisations
Australia is one of 164 members of the World Trade Organization (WTO), the body that is responsible for negotiating global trade rules and resolving trade disputes. The WTO has also been vital for maintaining a stable global trading environment during the pandemic and will play a key role in economic recovery. We want to see the WTO reinvigorated with a more effective dispute settlement mechanism. This will make it stronger and more relevant to today’s trade environment.
To this end, we are leading an initiative to develop international rules for e-commerce, and pushing for global agricultural reforms to address trade-distorting agricultural subsidies. At the same time, we are working to strengthen global trade in services rules.
Australia is an active and effective member of the Group of Twenty or G20, the world’s premier forum for international economic cooperation. The G20’s geographically dispersed membership of 19 countries and the European Union represent over 85 per cent of the world economy, more than 75 per cent of global trade and almost two-thirds of the world’s population. Australia hosted the G20 in 2014. We are working with Italy as it has the 2021 Presidency.
We promote our regional trade and investment interests through our membership of the Asia-Pacific Economic Cooperation (APEC) forum. APEC is the premier economic organisation in a region with 2.9 billion people that generates around 60 per cent of world GDP. The collaborative approach to breaking down barriers to trade across our region has yielded a wide range of reforms since APEC was founded in 1989. These reforms have directly benefitted Australian businesses and consumers and added to the region’s prosperity.
In 2021, Australia celebrates 50 years of membership in the Organisation for Economic Co-operation and Development (OECD). The OECD is the world’s premier economic policy development and standard setting body. Its 37 member countries, from Europe, the Americas and the Indo-Pacific, represent around 50 per cent of global GDP and are committed to developing and delivering better policies for better lives. Founded on a shared commitment to liberal democratic values, human rights and a rules-based international order, the OECD is a trusted and credible source of data, analysis and policy advice.The Hon Mathias Cormann commences as the OECD Secretary-General on 1 June 2021, the first time an Australian will lead the organisation – a significant opportunity to strengthen the links between OECD members and the Indo-Pacific region.
Australia also supports global cooperation, policies and dialogue to facilitate trade and investment through our membership of a range of other bodies, including the World Intellectual Organization and World Customs Organization.
Australia in value chains
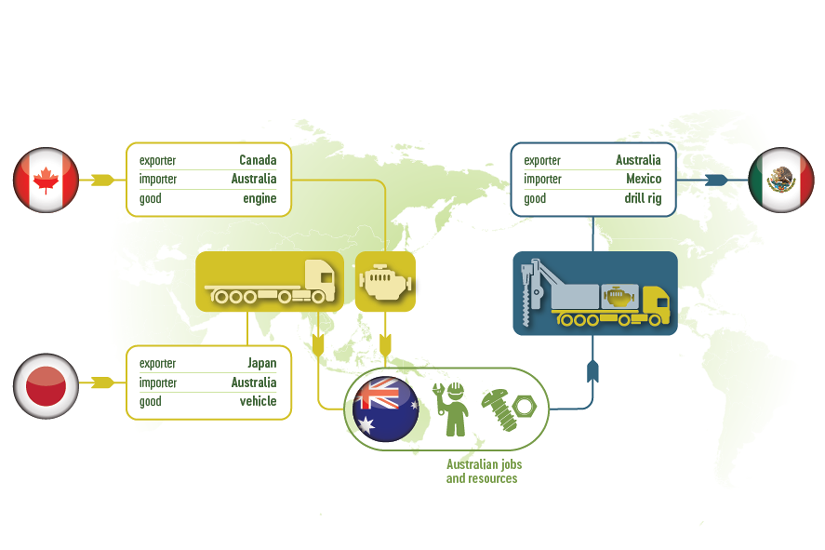
A Global Value Chain (GVC) is a network of interlinked stages of production in the manufacture of goods and services that cross international borders.
GVCs are becoming an increasingly important feature of international trade and investment, particularly in Asia. The benefits to industry, business, exporters and consumers from participation in GVCs are manifold. GVCs provide scope for firms to enter markets by specialising in niche intermediate activities within a chain and allow suppliers to upgrade production into higher-value segments of their industries.
As an example of a GVC a mining technology business in Queensland, that designs and produces drilling machinery could import vehicles from Japan and engines from Canada. The Australian business could then combine the imported inputs with parts supplied domestically to produce a drilling rig for export.
More information
- Australia’s Trade Through Time navigate milestones in Australia’s trading history on an interactive timeline
- Subscribe to the business envoy quarterly magazine connects DFAT’s diplomatic network to Australian business
- Composition of Trade Australia analyses the composition, direction and commodity breakdown of Australia’s trade
- Trade in Services Australia details the composition and direction of Australia’s services trade, bi-annually
- International Investment Australia provides a detailed snapshot of Australia’s inwards and outwards investment on a calendar year basis
- Australia’s trade by State and Territory gives a breakdown of each Australian state and territory’s goods and services trade
- Case studies of how small and medium enterprises benefit from international trade and/or foreign investment
- Trade and investment articles enhancing understanding of trade trends
Department of Foreign affairs and trade Australian office network
Head Office
Canberra
Ph: 02 6261 1111
Australian offices
New South Wales state office
Sydney (DFAT switchboard)
Ph: 02 6261 1111
Northern Territory office
Darwin
Ph: 08 8982 4199
Queensland state office
Brisbane
Ph: 07 3405 4799
South Australia state office
Adelaide (DFAT switchboard)
Ph: 02 6261 1111
Tasmania state office
Hobart
Ph: 03 6238 4099
Victoria state office
Melbourne
Ph: 03 9221 5444
Western Australia state office
Perth
Ph: 08 9231 4499


 1 China. 2 United States. 3 Japan. 4 Republic of Korea. 5 United Kingdom.


 Alt text in table below.">


 Alt text in table below.">
