Publications
Achieving the APEC Bogor Goals progress by Australia and the region
Contents
Overview
Asia Pacific Economic Cooperation (APEC)
Since the creation of APEC under the Hawke Government in 1989, and its elevation to a Leaders- level process under the Keating Government in 1993, APEC has become the pre-eminent economic forum in the Asia Pacific, the world's fastest growing and most economically dynamic region. APEC's 21 member economies account for 54 per cent of world economic output and 44 per cent of global trade.1
The Bogor Goals
In their 1994 Bogor Declaration, APEC Leaders agreed to the common goals of free and open trade and investment by 2010 for industrialised economies and 2020 for developing economies. They agreed to pursue these targets, known as the Bogor Goals, by reducing barriers to trade and investment to promote the free flow of goods, services and capital among APEC economies. The Bogor Goals reflected the shared belief that free and open trade and investment were essential to realising the region's growth potential and enhancing economic and social outcomes for all APEC economies.
Australia has played a leading role in shaping APEC's agenda over the past 21 years, helping to map the way in which economies would pursue free and open trade and investment. The Bogor Goals provided a clear focus for the APEC vision of economic co-operation and open regionalism, and since their establishment, the Goals have embodied the core APEC principles of voluntary co-operation, comprehensiveness, and consensus- based decision-making, underpinned by unilateral and collective actions.
Assessing achievements
This report considers APEC's progress towards the 2010 Bogor Goals, focusing primarily on the achievements of industrialised economies – Australia, Canada, Japan, New Zealand and the United States. In 2010, eight developing economies also volunteered for assessment against the 2010 Bogor Goals. These economies are Chile, Hong Kong China, Korea, Malaysia, Mexico, Peru, Singapore and Chinese Taipei. Progress made by these developing economies provides a useful comparison for the industrialised group of APEC members.
The evidence indicates that as a group, APEC's industrialised economies have reduced the average applied tariff rate from 7.0 per cent in 1996 to 3.9 per cent in 2008, with an estimated 60.1 per cent of imports entering duty free, up from 42.6 per cent in 1996. This has contributed to the high levels of trade among APEC economies. Under APEC's business facilitation agenda, a focus on policy and regulatory harmonisation and co-operation has lowered non-tariff barriers. And APEC's comparatively recent work on services and investment is opening up new sectors to trade and reducing restrictions on inward and outward investment flows.
While APEC's industrialised economies have made good collective progress towards the Bogor Goals, Australia's individual achievements in trade and investment liberalisation and facilitation have been exceptional. Australia is one of the most open, and as a result, strongest performing economies in all of APEC.
But despite APEC's overall progress, the lowering of barriers to trade and investment has not been uniformly impressive across all sectors. The agricultural sector and some industrial sectors (such as textiles, clothing and footwear) are still afforded conspicuously high levels of protection, both at the border and through domestic support for producers and manufacturers. In the agricultural sector, the level of protection for producers varies greatly among economies. Australia, as a vigorous proponent of free agricultural trade, has one of the most open agricultural sectors in APEC.
As well as in agriculture, there is considerable scope among APEC economies for further progress in freeing up investment and trade in services. Australia has played an instrumental role in forging a renewed commitment in APEC to tackle impediments to services and investment through multiyear Action Plans on services trade and investment facilitation.
Changing economic landscape
Since 1994, APEC's regional economic landscape has undergone profound transformation. Economies in our region, and across the world, are more tightly interconnected than ever before. Enabled by falling barriers to trade and a growing integration of financial markets, businesses have grown multinational in scope, tapping into supply chains that transcend traditional economic and geographic boundaries.
But these same globalising processes have also revealed new risks, most notably the financial and economic contagion resulting from crises, such as the Asian Financial Crisis in the late 1990s and the Global Financial Crisis that began in 2007. In addition, natural disasters, terrorism and regional pandemics threaten economic security and global co-operation on trade and investment liberalisation. Despite these challenges, and despite the temptation to resort to protectionism during the Asian and Global Financial Crises, APEC economies have held firm to their Bogor commitments.
Increased economic connectivity among APEC economies, fostered by pursuit of the Bogor Goals, has demonstrated the importance and value of collective efforts to facilitate recovery and insure the region against underlying vulnerabilities. APEC has proved an invaluable forum by encouraging co-operative and collaborative actions, as well as unilateral efforts, to improve economic resilience without compromising the potential upside of globalisation.
The way forward
The APEC economies' achievements in moving towards free and open trade and investment do not mean their work is complete. APEC's agenda must continue to evolve in response to emerging priorities. It is becoming increasingly evident that the region's next growth increment will depend on reforms that go well beyond the further reduction of border protection. The changing nature of the global economy is changing the way policy makers are thinking about trade and investment, broadening their attention beyond tariff liberalisation to include an increased emphasis on business facilitation and structural reform. The potential gains to be made by furthering business access to new, more efficient commercial and capital markets are enormous. According to the World Bank, even modest improvements in APEC's trade facilitation performance could boost intra-APEC trade by around 10 per cent or US$280 billion.
If APEC is to move beyond the Bogor Goals, it will need a new long-term vision to focus the individual and collective efforts of member economies to deliver ongoing growth and prosperity. This new goal should not only match the ambition of the Bogor Goals but capture the full scope of APEC's expanded agenda. APEC's renewed emphasis on challenges such as structural reform, trade logistics, and infrastructure development will define its success over the next two decades.
Achievements
The Bogor Declaration reflected a shared belief among APEC Leaders that free and open trade and investment were essential to delivering growth, prosperity and improved social outcomes for all APEC economies.
Trade and investment have expanded substantially
Since 1994, total exports from industrialised economies (to other APEC economies and the rest of the world) have more than doubled, while imports have almost tripled. In addition, the eight volunteer developing economies experienced a three-fold increase in exports and a doubling of imports (Chart 1).
1. Changes in the global trade of APEC industrialised and volunteering economies (US$)
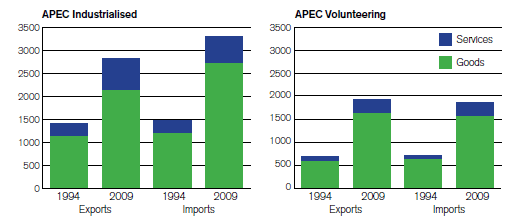
Data source: International Monetary Fund (IMF), Direction of Trade Statistics online database; Chinese Taipei's Bureau of Foreign Trade; APEC Policy Support Unit.
Stocks of inward and outward foreign direct investment (FDI) involving the five industrialised economies quadrupled from 1994 to 2009. The eight volunteering economies also experienced strong increases in stocks of inward investment, and a massive nine-fold increase in stocks of outward investment, despite a downturn during the Global Financial Crisis (Chart 2).
2. Stocks of inward and outward FDI, APEC industrialised and volunteering economies
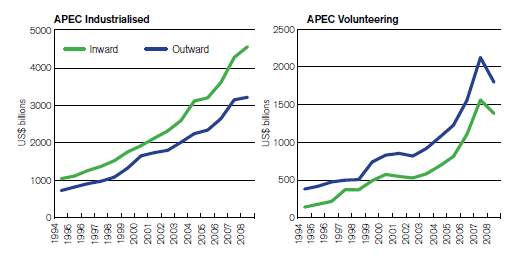
Data source: United Nations Conference on Trade and Development (UNCTAD), Foreign Direct Investment Statistics online database.
Australia has benefited greatly from its trade and investment linkages with APEC. Total two-way trade between Australia and APEC economies has grown from A$122 billion in 1994 to A$350 billion in 2009, an average annual growth rate of 7.4 per cent. Over the same period, investment into Australia by APEC economies rose by 10.7 per cent per year to reach A$791 billion in 2009, with outward Australian investment into the APEC region growing by an average of 16.7 per cent per year to peak at A$641 billion in 2009.2
Increases in the trade and investment performance of APEC economies have brought significant improvements in the economic wellbeing of individuals. In the period 1994 to 2008, real per capita gross domestic product (GDP) in the group of industrialised economies grew by 25 per cent from US$29,790 to US$37,174. For the volunteer developing economies, real GDP per capita rose 49 per cent from US$6,561 in 1996 to US$9,769 in 2008 (Charts 3 and 4).
3. Real GDP/capita for APEC industrialised economies
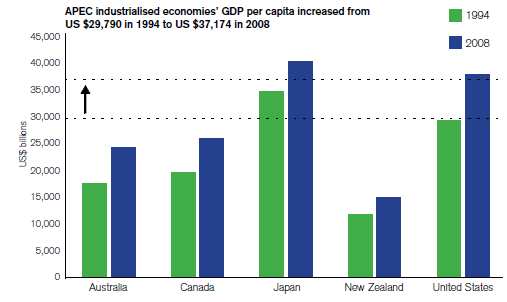
Note: Real GDP is in constant US dollars (2000)
Data source: World Bank, World Development Indicators online database
4. Real GDP/capita for APEC volunteering economies
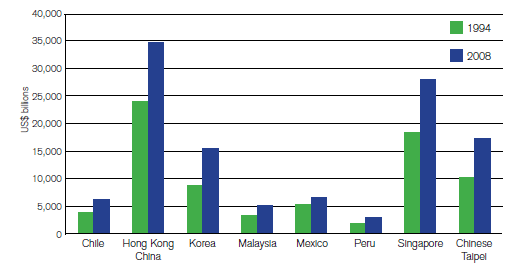
Note: Real GDP is in constant US dollars (2000)
Data source: World Bank, World Development Indicators online database, International Monetary Fund, World Economic Outlook database.
Liberalisation has been a key driver of this expansion
Tariffs have fallen and many more products are traded duty free
A central feature of APEC's progress towards the Bogor Goals has been the reduction of tariffs on imports. APEC economies have pursued tariff reductions by implementing commitments made in multilateral, regional and bilateral agreements. In addition, APEC placed an emphasis on liberalisation through unilateral action, encouraging economies to open their borders to take advantage of the direct benefits that liberalisation brings, and not just as a way to negotiate reciprocal market access.
Australia provides an excellent example of the overall benefits of unilateral trade liberalisation. In the mid 1980s, Australia's manufacturing sector was one of the most protected in the world. But as part of a broader program of structural economic reform, successive governments progressively opened up Australia's borders to trade and investment which, along with the removal of restrictions on capital controls, transformed the domestic economy into one of the most flexible, resilient and well-performing economies in the OECD.3
In APEC, tariff reduction programs undertaken by the industrialised economies have delivered sizeable falls in the average applied tariff on imports, and a substantial increase in the proportion of imports entering tariff free. The average applied Most Favoured Nation (MFN) tariff rate for the industrialised APEC economies fell from 7.0 per cent in 1996 to 3.9 per cent in 2008 (compared to the 2008 world average of 10.4 per cent).4 For industrialised economies, the share of imports entering duty free has increased from 42.6 per cent in 1996 to an estimated 60.1 per cent in 2008.5 This figure only takes into account trade conducted on an MFN basis. In reality, because trade also takes place among partners to free trade agreements, the proportion of imports entering duty free into APEC's industrialised economies would be higher than 60 per cent. The volunteering developing economies have also reduced applied tariffs significantly, with the average tariff rate falling from 8.9 per cent in 1996 to 6.4 per cent in 2008, well below the world average.
Australia is one of the strongest performers in APEC in terms of applied tariff reduction, halving its average applied tariff rate from 7.0 per cent to 3.5 per cent in the period 1996 to 2008 (see Chart 5). Australia, with the US, has the equal fourth lowest average applied tariff in APEC. Only New Zealand (2.2 per cent) and the zero tariff economies of Singapore and Hong Kong have lower tariffs than Australia.
5. Simple average applied MFN tariff for APEC industrialised and volunteer developing economies
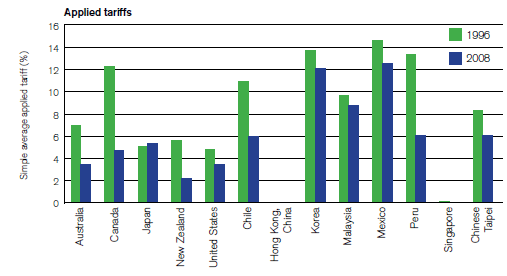
Data source: 1996 and 1998 figures from APEC Secretariat (1999), Open Economies Delivering to People: APEC's decade of Progress; 2008 figures sourced from World Trade Organization (WTO), Tariff Download Facility online database; United Nations Conference on Trade and Development (UNCTAD), Trade Analysis and Information System (TRAINS) online database; World simple average data from World Tariff Profiles 2009.
While the overall average applied tariff across all goods has dropped significantly for most of the industrialised and volunteer developing economies, the reduction has not been achieved uniformly across all sectors. Average applied tariffs for some sensitive sectors – particularly agricultural products, footwear, headgear and textiles – remain conspicuously higher than the average. Across the industrialised and volunteer developing APEC economies, three of the four most protected sectors are agricultural (Chart 6).
6. Sectoral variation in the average applied tariff for industrialised and volunteer developing economies
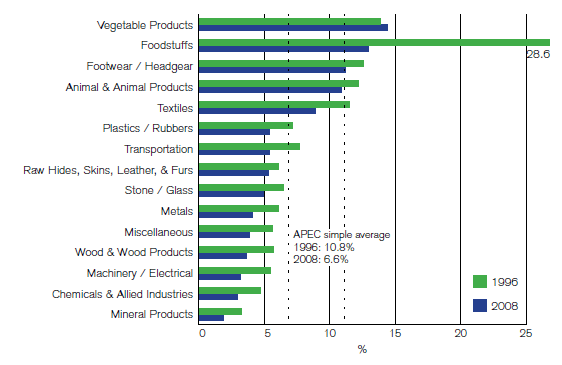
Data source: APEC Secretariat Policy Support Unit (PSU) (2010), Progressing towards the APEC Bogor Goals: Perspectives of the APEC Policy Support Unit.
With the exception of Australia, New Zealand, Chile, Singapore and Hong Kong, applied tariffs on agricultural goods in APEC are on average 3.5 times higher than applied tariffs on non-agricultural products (Chart 7).
7. Simple average applied tariff for agricultural and non-agricultural products (2008)
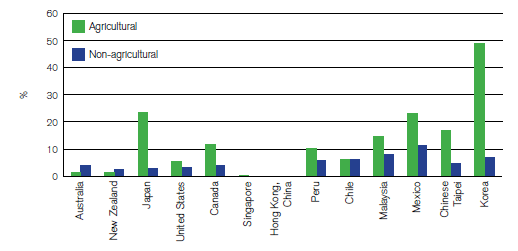
Data source: World Trade Organization (WTO), World Tariff Profiles (2009)
Good progress on reducing non-tariff measures
APEC industrialised economies have also made progress in reducing non-tariff measures (NTMs). NTMs refer to measures other than tariffs that result in a distortion of trade, including quantitative restrictions, price controls, subsidies, non-tariff charges, unwarranted customs procedures and discriminatory application of technical standards.
One of APEC's strengths is that it brings together technical experts through its various sub-fora and working groups to deal with issues such as harmonisation of standards and conformance, the streamlining of customs procedures through paperless trading and single windows, and the promotion of WTO-consistent non-tariff measures to pursue health, security, safety and environmental objectives.
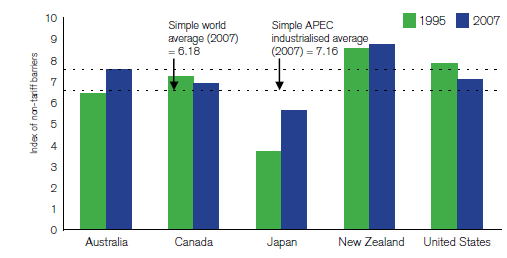
Due to the great variety of NTMs and variability in the way they are applied, NTMs are difficult to measure. One indicator of progress in reducing the trade-distorting effect of such measures is the index prepared by the Fraser Institute as part of its Economic Freedom program. This index measures business perceptions of the extent to which NTMs reduce the ability of imported goods to compete in the domestic market; the higher the index, the lower the perceived degree of restrictiveness. For Australia, as well as Japan and New Zealand, the index increased from 1995 to 2008, indicating that businesses perceive the restrictive effect of NTMs has fallen in these economies (Chart 8).
8. Index of Non-Tariff Measures Index of non-tariff barriers
Data source: Gwartney, James and Robert Lawson with Herbert Grubel, Jakob de Haan, Jan- Egbert Sturm, and Eelco Zandberg (2009). Economic Freedom of the World: 2009 Annual Report. Vancouver, BC: The Fraser Institute. 2009 dataset retrieved from www.freetheworld.com.
But agricultural subsidies remain an issue
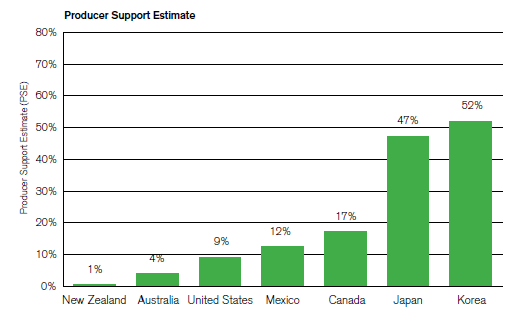
Depending on their magnitude and application, producer subsidies can be a particularly trade-distorting form of NTM, propping up inefficient producers and disrupting the optimum allocation of resources to sectors where comparative advantage is highest. The OECD Producer Support Estimate (PSE) is an indicator of the annual monetary value of gross transfers from consumers and taxpayers to support agricultural producers. According to the OECD, Australia and New Zealand are among the lowest users of producer subsidies in the agriculture sector. In contrast, the agriculture sectors of Japan and Korea are highly reliant on subsidies.
9. Producer Support Estimates for selected APEC economies (% of gross farm receipts, 2007-09 average)
Data source: Organisation of Economic Co-operation and Development, Agricultural Policies in OECD Countries (2010)
Barriers to trade in services are falling
The APEC industrialised economies have engaged in unilateral, regional and multilateral efforts to liberalise trade in services. Trade in services is more complex than trade in goods due to the different ways in which trade can occur, and the different forms of regulation that can restrict services supply. Consequently, the measurement of services trade liberalisation is a difficult task. One conservative method is to examine the depth of liberalisation undertaken by APEC economies under the WTO General Agreement on Trade in Services (GATS).
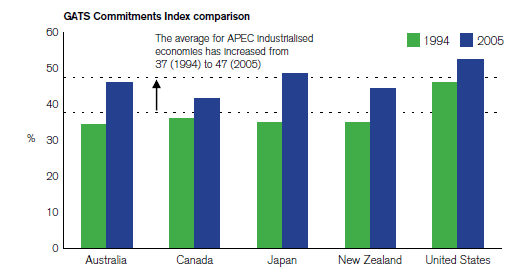
An analysis based on an index comparing economies' original GATS commitments with offers made in 2005 as part of the Doha Round of WTO negotiations indicates that the industrialised economies are prepared to offer a significant increase in the level of services trade liberalisation (Chart 10). Furthermore, many APEC economies have made additional commitments on services in their regional and free trade agreements.6 Many economies do not impose restrictions on some services sectors even though these policy positions are not legally bound. In practice, services trade is freer than that reflected by commitments under the GATS and in free trade agreements.
Recently, APEC economies have recognised the need to do more in APEC to boost services trade and the development of open, competitive services sectors. The Services Action Plan, endorsed by Leaders in 2009, has provided an overarching level of coordination, coherence and focus to the APEC's services-related work. Noting the growing importance of services in economic development and as a component of world trade, APEC economies have intensified their work on services across a broad range of APEC sub-fora, including in the areas of professional services (legal services and accountancy), transport and logistics, ICT, tourism and movement of business people.
10. GATS Commitments Index comparison
Data source: APEC Secretariat Policy Support Unit (PSU) (2010), Progressing towards the APEC Bogor Goals: Perspectives of the APEC Policy Support Unit, PSU calculation based on the WTO 1994 Schedule of Commitments and 2005 Revised Offers from APEC member economies.
APEC economies are liberalising investment
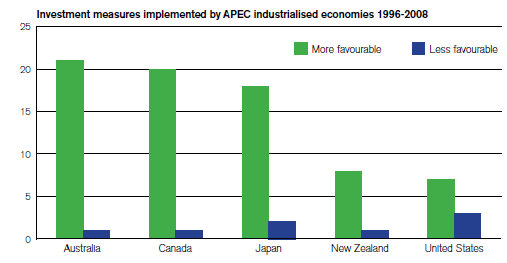
Most APEC economies made extensive efforts to liberalise foreign investment in the late 1980s and early 1990s. The APEC Non-Binding Investment Principles adopted in 1994 served as a reference for APEC members to open their economies to foreign investment.7 While some restrictions on foreign ownership remain, the industrialised economies have continued to liberalise investment. Between 1996 and 2008, the number of investment-related policy measures implemented by industrialised economies that were favourable to foreign investment greatly exceeded the number of measures unfavourable to investment (Chart 11). On this basis, Australia is the strongest performer of all APEC industrialised economies.
11. Investment measures implemented by APEC industrialised economies 1996-2008
Data source: UNCTAD World Investment Reports 1997-2009.
In 2007, APEC Leaders agreed to develop an Investment Facilitation Action Plan (IFAP) which identified principles and actions designed to promote transparency, simplicity and predictability in the policy and administrative environment for investment and cross border investment flows. The IFAP has been designed as a guide for APEC economies to begin taking voluntary action to improve their investment regimes.
Trade and investment facilitation has been a key focus of APEC efforts
The Bogor Declaration emphasised the importance of trade and investment facilitation to complement liberalisation efforts. In establishing the APEC Trade Facilitation Action Plans (TFAP-I and TFAP-2), APEC economies set about reducing trade transaction costs (by 5 per cent between 2002 and 2006, and a further 5 per cent by 2010) through a range of initiatives targeting movement of goods, alignment of standards, business mobility and electronic commerce.
The success of these activities is evidenced by improvement in the World Bank's Doing Business Trading Across Borders indicators. The Trading Across Borders indicator summarises information on the number of documents, the time taken, and the cost of importing and exporting goods and services. According to the World Bank index, APEC industrialised economies outperform world averages.
APEC's industrialised economies have reduced the number of documents and time required to trade (Chart 12). While the cash costs associated with these processes may have increased in nominal terms, time reductions have led to a lowering of overall costs. It is estimated that the average cost of trading across the whole of APEC fell by about 7 per cent between 2001 and 2007.8
12. Average percentage improvement in the number of documents and time taken to import and export.
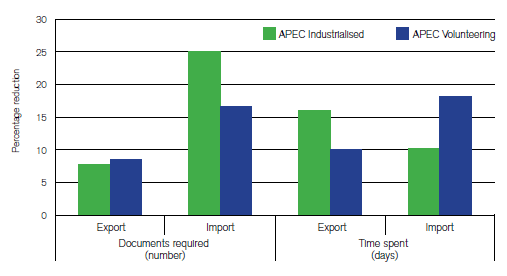
Data source: World Bank Doing Business Indicators, 2006, 2007 and 2010.
Human security and economic and technical co-operation an important element of the APEC agenda
Since the Bogor Declaration, APEC has addressed the economic dimensions of human security, recognising that threats such as terrorism, natural disasters and regional pandemics could undermine efforts to raise living standards and reduce poverty. APEC's agendas for human security and trade and economic development are complementary: human security is essential to growth and prosperity. Conversely, economic stability enables better preparation for, more efficient responses to, and quicker recovery after attacks or disaster. APEC economies have worked collectively to address the effects of financial crises, terrorist attacks, the SARS pandemic, the spread of bird flu, the Indian Ocean Tsunami, and energy and food prices.
APEC has developed a range of targeted initiatives to address these threats, including work on emergency preparedness and recovery, counter terrorism and secure trade.
These initiatives are consistent with APEC's broader commitment to link economic and technical co-operation (ECOTECH) with the pursuit of trade and investment liberalisation and facilitation. APEC's ECOTECH agenda is broadly aimed at better positioning developing economies to profit from increased regional economic integration while at the same time insuring themselves against risks. ECOTECH activities have included the fostering of human resources and improving systems supporting trade and investment flows with a particular emphasis on trade facilitation, technical collaboration, the digital economy and small and medium enterprises, regional integration, structural reform and strengthening economic infrastructure. As of September 2009, APEC working groups and task forces had initiated 93 ECOTECH related projects.
Conclusion
The group of five APEC industrialised economies – Australia, Canada, Japan, New Zealand and United States – has made good progress towards the Bogor Goals of free and open trade and investment by 2010. Australia has been at the leading edge of trade and investment liberalisation and facilitation in APEC.
These economies have cut tariffs, increased the proportion of goods imported tariff free, reduced non-tariff measures, opened up services trade, liberalised investment and actively promoted greater trade and investment through facilitation initiatives. The average applied tariff rate for the industrialised economies fell from 7.0 per cent in 1996 to 3.9 per cent in 2008 (compared to the 2008 world average of 10.4 per cent). And the share of imports entering duty free has increased from 42.6 per cent in 1996 to 60.1 per cent in 2008.
Australia has done particularly well in the pursuit of free and open trade and investment. Twenty years of trade and investment liberalisation and structural reform has delivered Australia a high performing and resilient economy.
The progress by APEC economies towards the Bogor Goals demonstrates the value of APEC's consensus-based, cooperative approach. Importantly, the assessment of progress has also highlighted the areas where more work is needed, including in the reduction of high tariffs and trade-distorting non-tariff measures on agricultural and textile, clothing and footwear products, and an increased focus on services and investment.
The gathering pace of globalisation poses real challenges for trade and economic policy makers in the region. To an increasing degree, the economic performance of individual APEC members is dependent on the prosperity and economic management of their trading and investment partners.
Global dynamics have created the impetus for APEC economies to tackle a broader set of issues in their efforts to foster and reap the gains from greater economic integration. As border barriers to trade and investment have fallen, attention has necessarily turned to domestic impediments that constrain domestic as well as foreign economic activity. The threats posed by economic crises and natural disasters has prompted APEC economies to co-operate more intensively on risk management and recovery strategies. First and foremost this has served to highlight the need to place a stronger emphasis on structural reform in APEC's forward agenda.
- 1 Asia Pacific Economic Cooperation, StatsAPEC, Key Indicators Database, accessed on 18 October 2010
- 2 Trend averages for total trade, incoming and outgoing investment calculated using data from 1993 to 2009 for APEC's current 21 economies. Calculations based on DFAT STARS database and ABS catalogue 5368.0.55.004 and ABC catalogue 5352.0.
- 3 Centre for International Economics, Benefits of Trade and Trade Liberalisation (2009).
- 4 Simple average of all tariffs applied on a "Most Favoured Nation" (MFN) basis, referring to the tariff rate WTO members apply to imports from all other members, unless they are eligible for more preferential treatment under another agreement.
- 5 Data source: APEC Secretariat Policy Support Unit.
- 6 WTO 2010, APEC: The Bogor Goals, Note by the WTO Secretariat, p. 5.
- 7 These principles addressed issues such as transparency, non-discrimination, national treatment, investment incentives, protection of investor rights, and movement of business people.
- 8 "Measuring the Impact of Trade Facilitation", thesis submitted by Ms Suraya Abdul Halim as partial fulfillment of BEc (Hons) degree at Adelaide University, October 2009. The results estimate APEC's performance on top of globally reducing trade costs. Cited at APEC Policy Support Unit report, Progressing towards the APEC Bogor Goals (2010).
Download