Trade at a Glance 2013
Around two-thirds of Australian agricultural production is exported. As part of efforts to reduce distortions in global agricultural trade and improve market access for Australian exports, Australia is committed to agricultural trade reform in the WTO.
Australia is chair of the WTO Cairns Group coalition of 19 agricultural exporting countries. The Cairns Group brings together a diverse range of developed and developing countries from Latin America, Africa and the Asia-Pacific region, and has been an influential voice in the agricultural reform debate since its formation in 1986.
| Members of the cairns group | |||
|---|---|---|---|
| Argentina | Chile | Malaysia | The Philippines |
| Australia | Colombia | New Zealand | South Africa |
| Bolivia | Costa Rica | Pakistan | Thailand |
| Brazil | Guatemala | Paraguay | Uruguay |
| Canada | Indonesia | Peru | |
Agriculture, fisheries & forestry exports
($ billion)
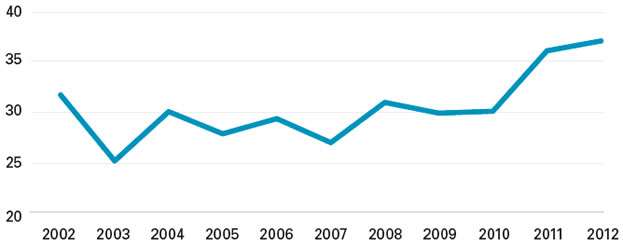
Based on ABS trade data on DFAT STARS database.
Australia's top agriculture, fisheries & forestry exports(a) 2012
| Rank | Commodity (b)(c) | $ million | % share |
|---|---|---|---|
| 1 | Wheat | 6,531 | 17.6 |
| 2 | Beef | 4,754 | 12.8 |
| 3 | Cotton | 2,626 | 7.1 |
| 4 | Wool & other animal hair (incl tops) | 2,524 | 6.8 |
| 5 | Meat (excl beef) | 2,370 | 6.4 |
| 6 | Wine | 1,891 | 5.1 |
| 7 | Oil-seeds & oleaginous fruits, soft | 1,780 | 4.8 |
| 8 | Barley | 1,317 | 3.5 |
| 9 | Animal feed | 1,301 | 3.5 |
| 10 | Vegetables | 1,249 | 3.4 |
| 11 | Milk, cream, whey & yoghurt | 1,234 | 3.3 |
| 12 | Live animals (excl seafood) | 1,050 | 2.8 |
| 13 | Hides & skins, raw (excl furskins) | 819 | 2.2 |
| 14 | Edible products & preparations | 810 | 2.2 |
| 15 | Cheese & curd | 740 | 2.0 |
| 16 | Fruit & nuts | 670 | 1.8 |
| 17 | Wood in chips or particles | 666 | 1.8 |
| 18 | Cereal preparations | 664 | 1.8 |
| 19 | Crustaceans | 632 | 1.7 |
| 20 | Rice | 343 | 0.9 |
| Total agriculture, fisheries & forestry exports | 37,158 | 100.0 | |
(a) Based on the WTO definition of agriculture, fisheries & forestry, which includes alcoholic beverages but excludes confidential raw sugar in bulk. Data for confidential raw sugar in bulk are released with a six-month lag. In 2012, raw sugar in bulk exports totalled $1.2 billion.
(b) Recorded trade basis.
(c) Excludes confidential items of trade.
Based on ABS trade data on DFAT STARS database.