
Australia recorded a trade deficit of $10.1 billion in 2014, a $437 million reduction on the deficit of $10.5 billion in 2013.
By Value – Australia's Exports
Australia's growth in goods and services exports has slowed in recent years, driven by a drop in prices for Australia's metals ores, minerals and coal. This is despite a growth in export volumes. Iron ore and coal exports accounted for 31.8 per cent of total exports in 2014.
Australia's top three exports in 2014 were Iron ores & concentrates ($66.0 billion), Coal ($38.0 billion) and Natural gas ($17.7 billion).
In 2013-14 Australia's tourism industry exports rose 4.1 per cent to $27.2 billion.
Exports of goods and services (a)
($ billion)
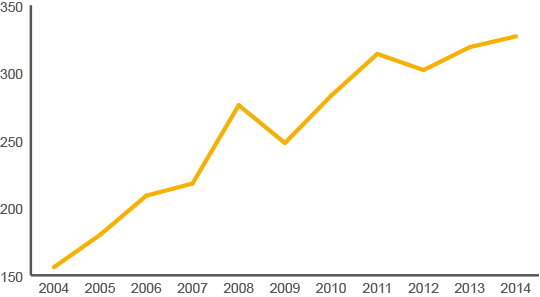
(a) Balance of payments basis.
Based on ABS catalogue 5302.0.
By Value – Australia's Imports
The value of Australia's goods and services imports grew on average 5.6 per cent per annum over the past five years.
In 2014, Manufactured products accounted for 54.2 per cent of total imports and Services accounted for 20.9 per cent.
Australia's top three imports in 2014 were Personal travel excluding education services ($24.6 billion), Crude petroleum ($20.0 billion) and Refined petroleum ($18.6 billion).
Imports of goods and services (a)
($ billion)
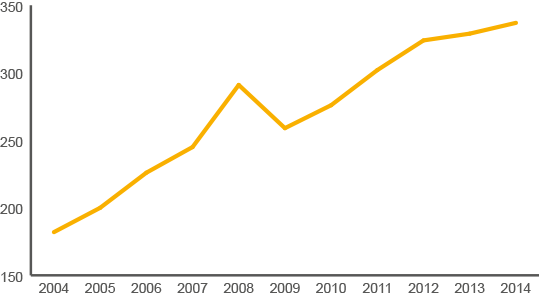
(a) Balance of payments basis.
Based on ABS catalogue 5302.0.