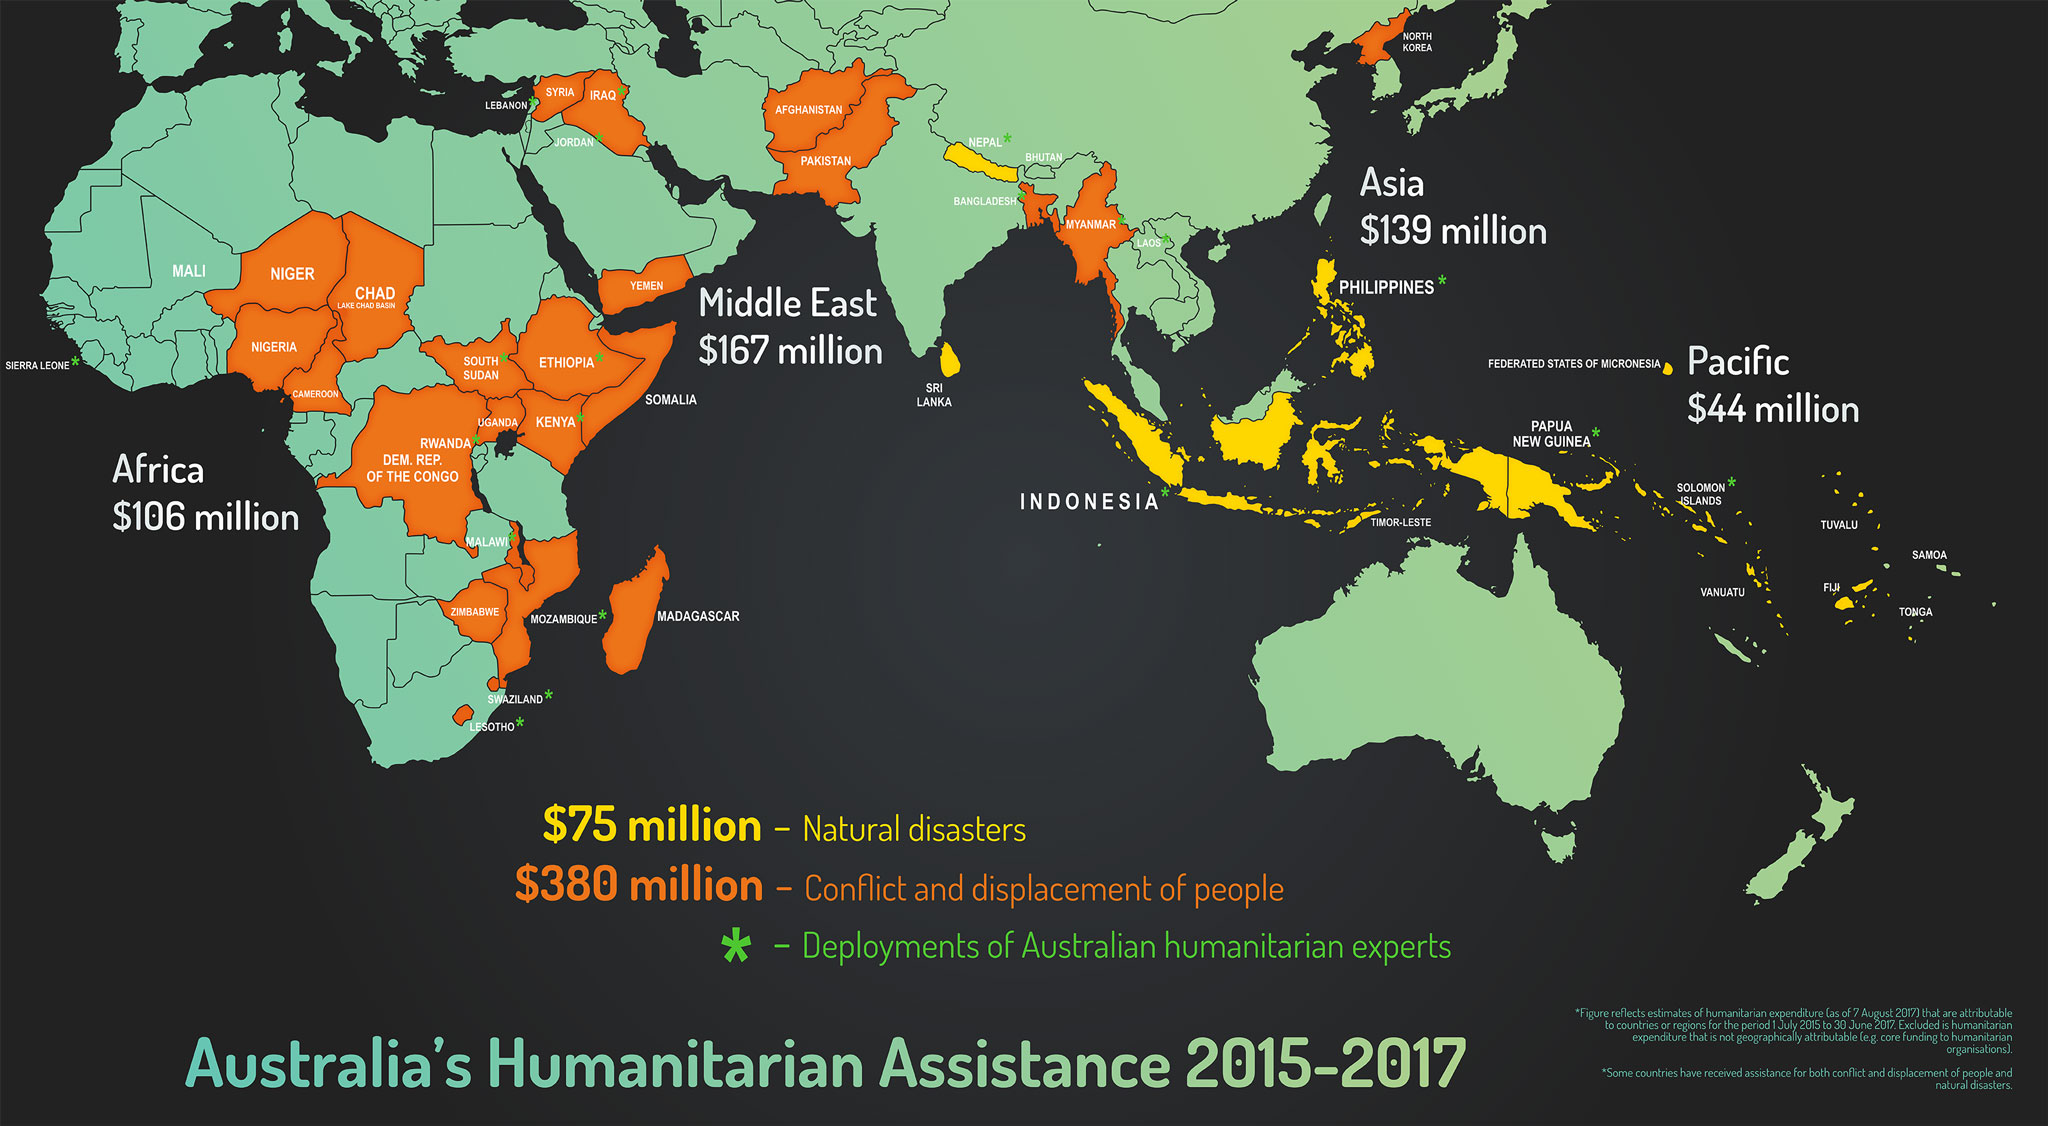
- $75 million – Natural disasters
- $380 million – Conflict and displacement of people
- * - Deployments of Australian humanitarian experts
- Africa $106 million
- Middle East $167 million
- Asia $139 million
- Pacific $44 million
*Figure reflects estimates of humanitarian expenditure (as of 7 August 2017) that are attributable to countries or regions for the period 1 July 2015 to 30 June 2917. Excluded is humanitarian expenditure that is not geographically attributable (e.g. core funding to humanitarian organisations).
*Some countries have received assistance for both conflict and displacement of people and natural disasters.
Last Updated: 21 August 2017